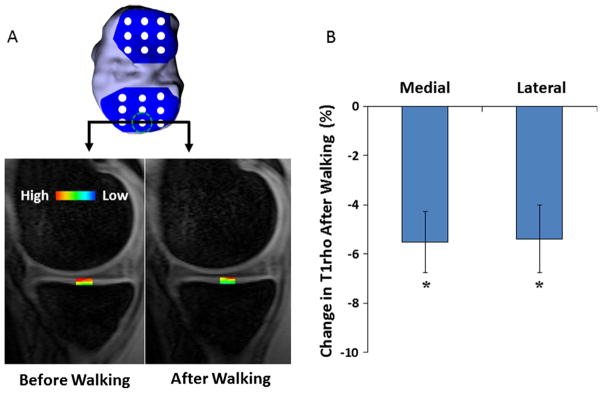
Fig. 7.
(A) A grid system was used to span the tibial (depicted here) and femoral cartilage surfaces (Lad et al., 2016) in order to measure T1rho relaxation times across the joint. The color map illustrates changes in T1rho relaxation values before and after walking on a treadmill. (B) Percent change in T1rho relaxation times resulting from the walking activity in both the medial and lateral compartments of the tibiofemoral cartilage. * indicates a statistically significant change in T1rho relaxation times after walking (p < 0.05).

