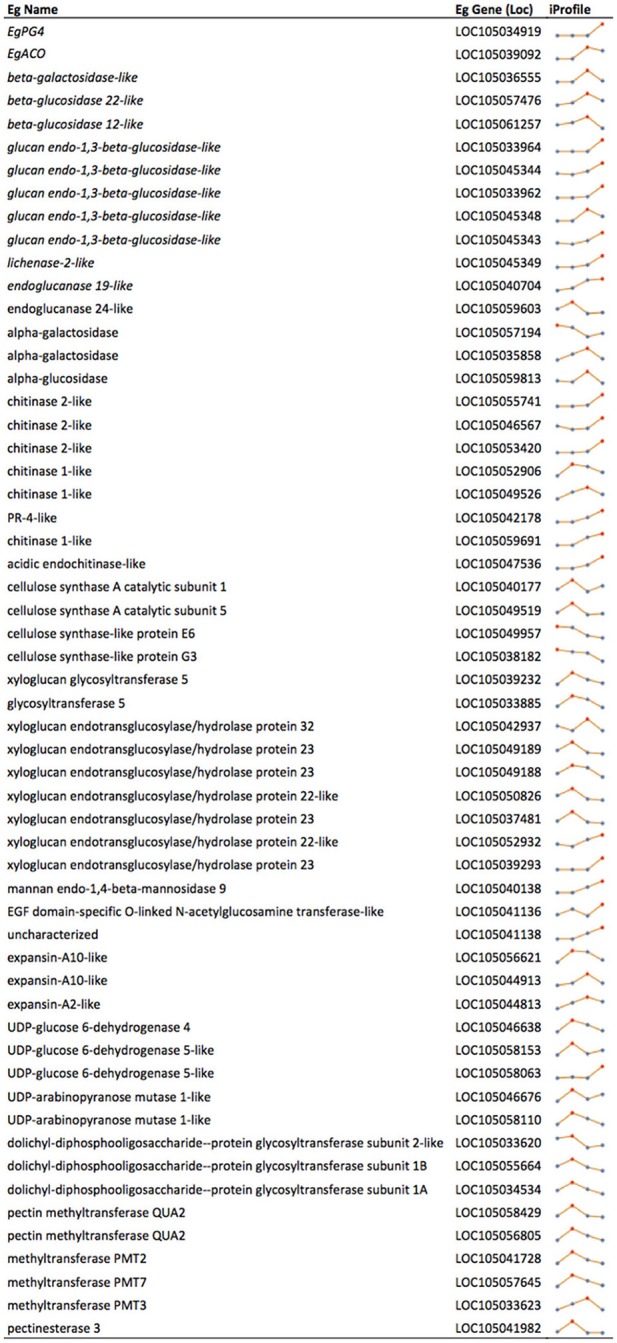
Figure 3.

Cell wall related transcripts with expression profiles in the mesocarp correlated to ripening stages concomitant with the increase in ethylene evolution at 140 and 160 DAP. EgACO and EgPG4 are included for a comparison as known ethylene inducible transcripts. Profiles are based on RNA-Seq Illumina (iProfile) sequencing at each developmental time point and expressed as RKPM (sum of all possible transcripts, XMs, for each gene locus) A, 100 DAP; B, 120 DAP; C; 140 DAP; C, 160 DAP; Eg, E. guineensis. Red dot in profiles indicates maximum read peak.
