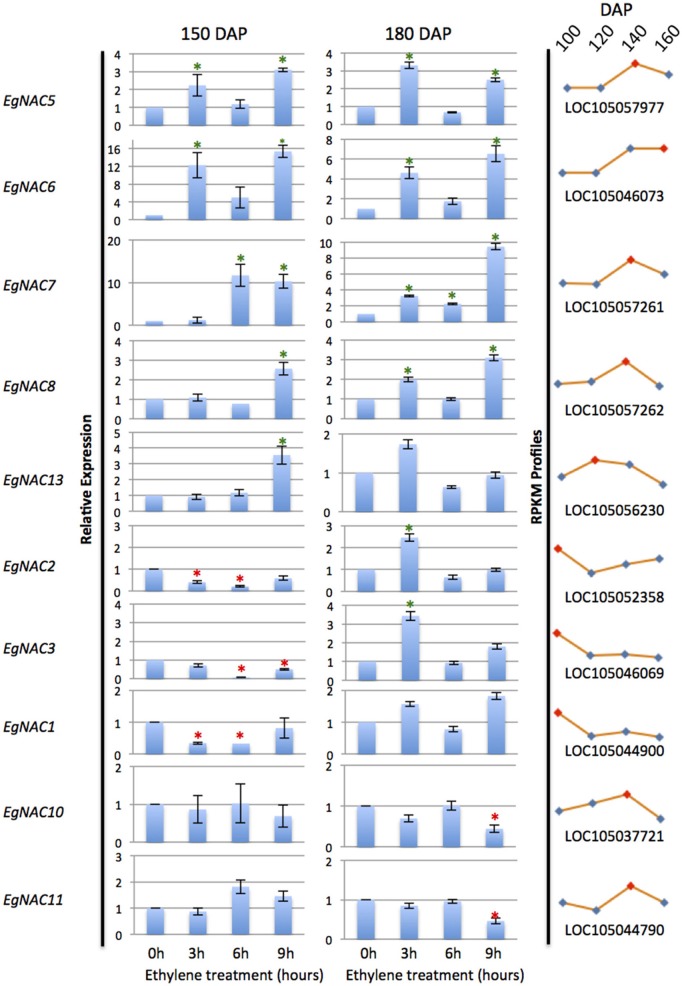
Figure 5.
qPCR analysis of NAC transcripts expressed in the mesocarp and induction in response to ethylene treatments. Asterisks indicate significant difference and increase or decrease in relative abundance by at least 2 fold (unpaired student's t-test P > 0.05) compared to the control at 0 h. Profile curves (right panels) are the corresponding E. guineensis gene locus expression during ripening at 100, 120, 140, and 160 DAP from RNA-Seq Illumina data.

