
Fig. 2. Multi-variable adjusted percent change in biomarkers as a function of loge -transformed urinary cotinine.
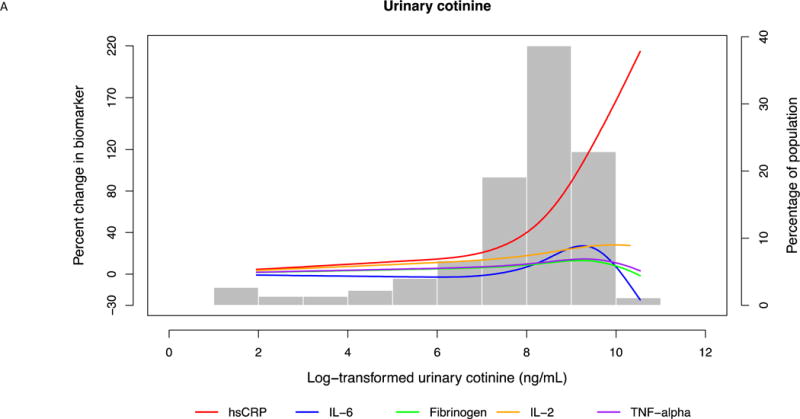
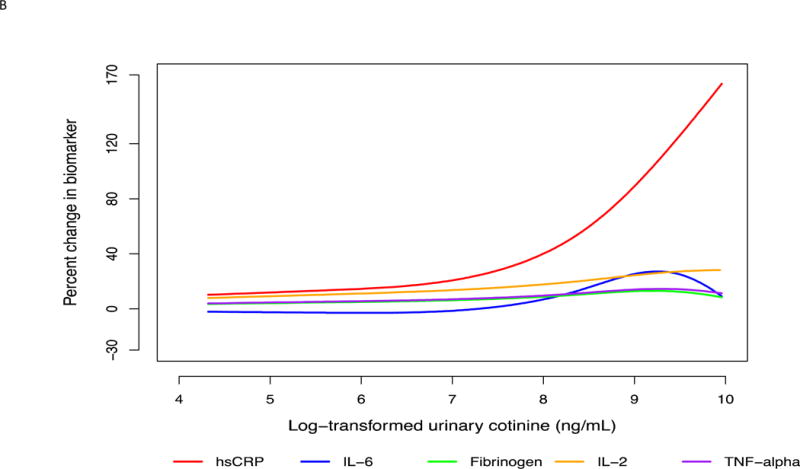
(A) For the entire range of cotinine. Restricted cubic splines were used with 3 knots placed at 5.60, 8.37 and 9.44 ng/mL cotinine. Splines were adjusted for age, sex, race, education, body mass index, systolic blood pressure, anti-hypertensive medication use, statin use, diabetes mellitus, heart rate, physical activity, alcohol use, and duration of smoking. (B) In the typical range of smoking intensity. Restricted cubic splines were used with 3 knots placed at 5.60, 8.37 and 9.44 ng/mL cotinine. Splines were adjusted for age, sex, race, education, body mass index, systolic blood pressure, anti-hypertensive medication use, statin use, diabetes mellitus, heart rate, physical activity, alcohol use, and duration of smoking.