FIGURE 2.

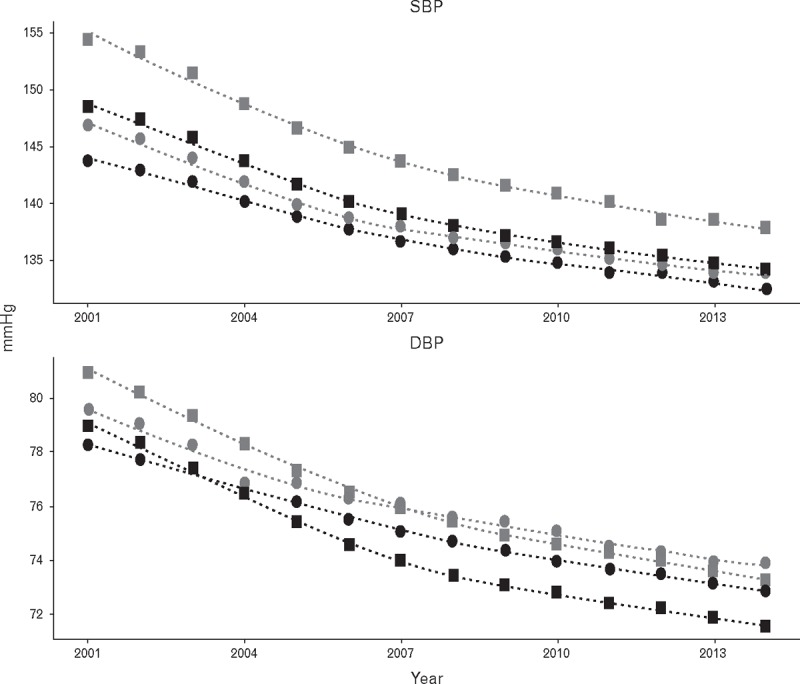
Trends in mean SBP and DBP in people aged 80 years or over from 2001 to 2014. Squares, women; circles, men; light symbols, treated with antihypertensive drugs; and dark symbols, not treated with antihypertensive drugs.

Trends in mean SBP and DBP in people aged 80 years or over from 2001 to 2014. Squares, women; circles, men; light symbols, treated with antihypertensive drugs; and dark symbols, not treated with antihypertensive drugs.