Fig. 6.

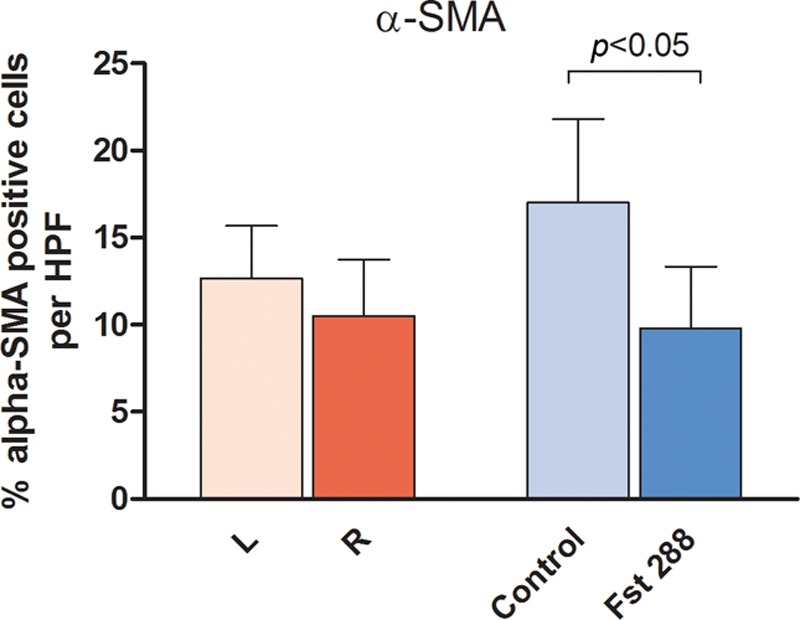
Immunohistochemistry analysis of α-SMA staining at 3 months (percentage of α-SMA–positive tissue per HPF) (A) baseline group and (B) Fst implant group. Results are expressed as mean ± standard error of the mean. HPF, high-powered field.

Immunohistochemistry analysis of α-SMA staining at 3 months (percentage of α-SMA–positive tissue per HPF) (A) baseline group and (B) Fst implant group. Results are expressed as mean ± standard error of the mean. HPF, high-powered field.