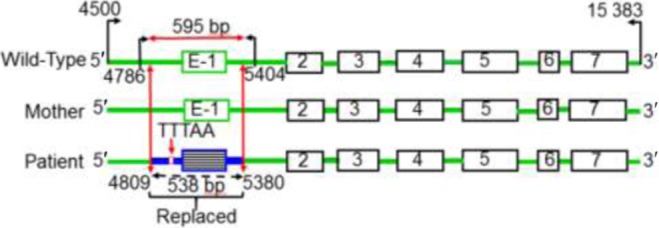
Figure 2.

Sequencing analysis of the STAR gene. The seven exons are indicated in boxes, and the PCR amplification of exon 1 including the promoter region and the detailed analysis of the PCR-amplified region are shown by the directional arrows in black. The primers used to amplify exon 1 are shown by black arrows, and the gene sequence is indicated by the specific number. The STAR gene from the mother and the wild-type control are also shown. The replaced region of the patient containing the exon, exon–intron boundary and the extended promoter region is shown in blue. These sequences (indicated in green) were completely identical, suggesting that a de novo exon 1 deletion in the patient.

 This work is licensed under a