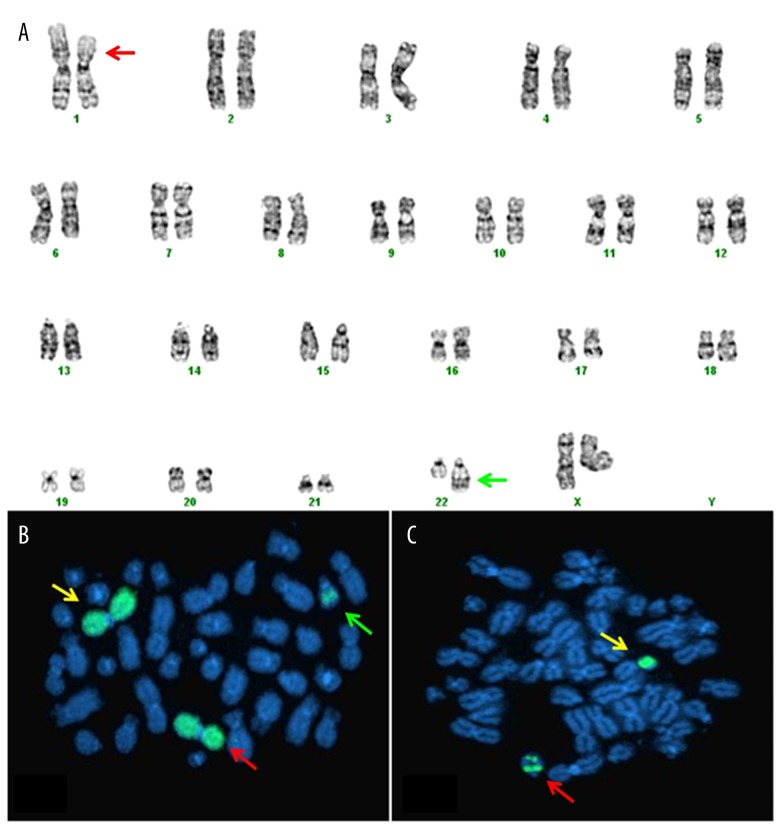
Figure 1.
(A) Karyotype showing 46,XX,ins(22;1)(q13;p13p31). The red arrow shows the region of deletion of p13q31 bands on chromosome 1. The green arrow shows the insertion of bands p13q31 of chromosome 1 on der(22) chromosome. (B) FISH using SG-labeled WCP 1 probe. Yellow arrow shows normal chromosome 1, red arrow indicates del(1), and green arrow shows der(22). (C) FISH using the SG-labeled WCP probe for chromosome 22. The red arrow shows the insertion of chromosome 1 bands. The yellow arrow indicates the normal chromosome 22.

