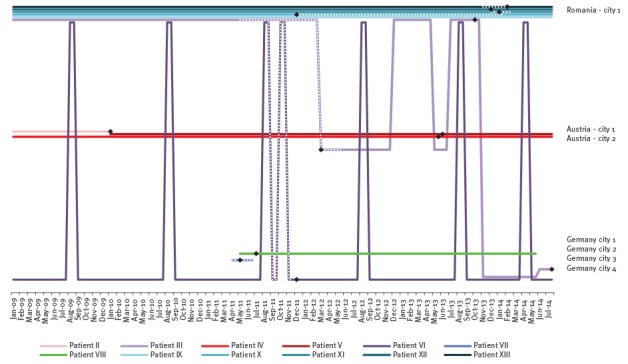
Figure 3.
Patient mobility per city/country and month, cluster of multidrug-resistant tuberculosis, Austria, Romania and Germany, 2010 to 2014 (n = 10)
Dotted lines: assumed period of infectiousness; black diamonds: dates of notification for patients II–XIII.

