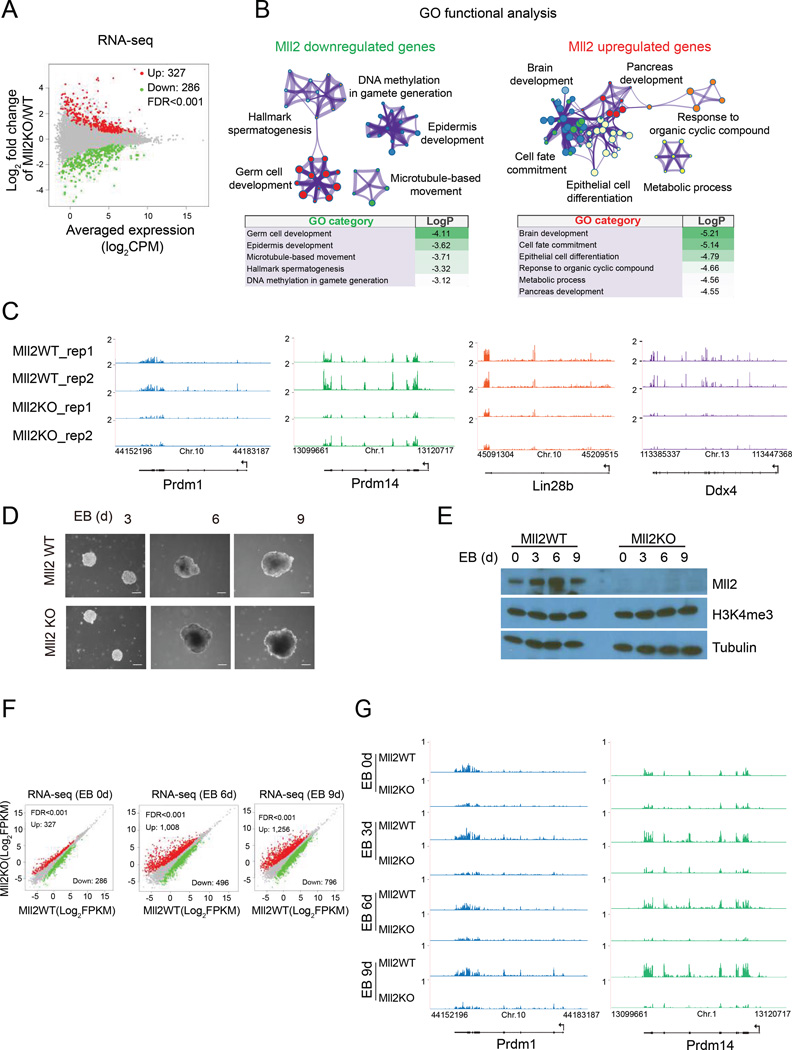
Figure 4. Mll2 is required for full expression of PGC genes during differentiation.
(A) MA plot of gene expression changes between parental and Mll2KO mESC as determined by RNA-seq. The x axis shows the log2 normalized counts per million (CPM) of averaged expression in the two conditions (A) and the y axis shows the log2 fold change in the two conditions (M). Significantly upregulated and downregulated are highlighted in red and green, respectively (FDR<0.001).
(B) Gene Ontology (GO) functional analysis for differentially expressed genes as determined by Metascape (Tripathi et al., 2015). Each node represents a functional term and its size is proportional to the number of genes falling into that term, with the color representing the cluster identity. Terms with a similarity score > 0.3 are linked by an edge. Log p-values are shown below the GO networks.
(C) UCSC genome browser RNA-seq tracks for regulators of PGC specification in parental and Mll2 knockout mESC.
(D) Representative phase contrast images of embryoid bodies (EBs) at indicated days derived from parental (Mll2 WT) and Mll2KO mESC.
(E) Western analysis of Mll2 levels during mESc cell differentiation into embryoid bodies. Tubulin serves as a loading control.
(F) Scatter plots showing differential gene expression of EBs derived from parental and Mll2KO mESC at different day points. Differentially expressed genes determined as in (A).
(G) UCSC genome browser RNA-seq tracks at Prdm1 and Prdm14 loci in mESC and indicated days of EB formation. See also Figure S4.

