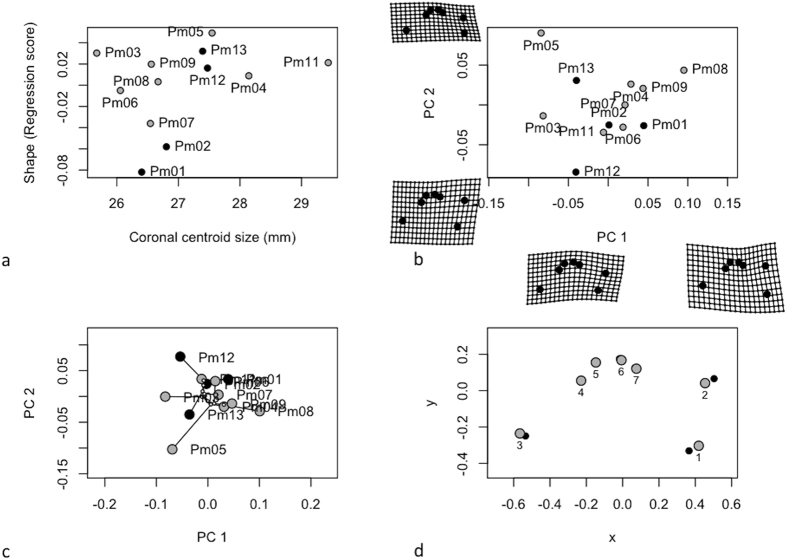
Figure 6.
Analysis of cochlear shape in transverse view (a) Allometry of cochlear shape represented by the regression of shape values (common allometric component) as function of the centroid size (b) Morphospaces defined by PC axes illustrating morphological diversity in sperm whale cochleae. Each point represents the average cochlea shape of an individual. Axes are principal component 1 (PC1) and principal component 2 (PC2) of the average scores from principal components analyses of mean Procrustes shape coordinates for each individual, (c) the phylomorphospace, a projection of the phenetic tree (UPGMA dendrogram) into the transverse view PC morphospace (d) estimated changes in transverse view shape are shown as deformations from the mean shape among the two stranding clusters. The shape differences have been amplified by a factor of two to aid in the description of shape differences and facilitate biological interpretation.

