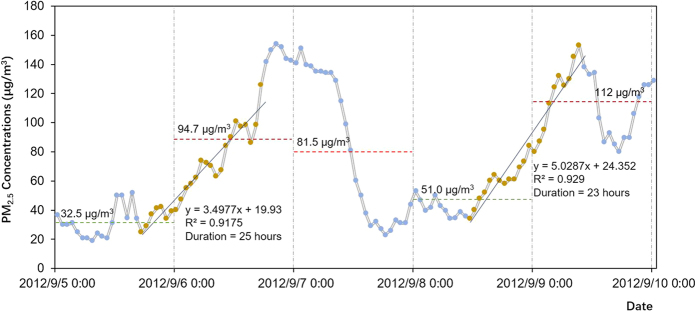
Figure 1. Two PM2.5 pollution processes in BJ and the corresponding daily mean PM2.5 concentrations.
Brown points denote the data points within the PM2.5 pollution processes filtered out in this study. Horizontal dashed lines denote the daily mean PM2.5 levels, with the red lines referring to polluted days and the green lines referring to the attainment days measured by the static standard of 75 μg/m3.

