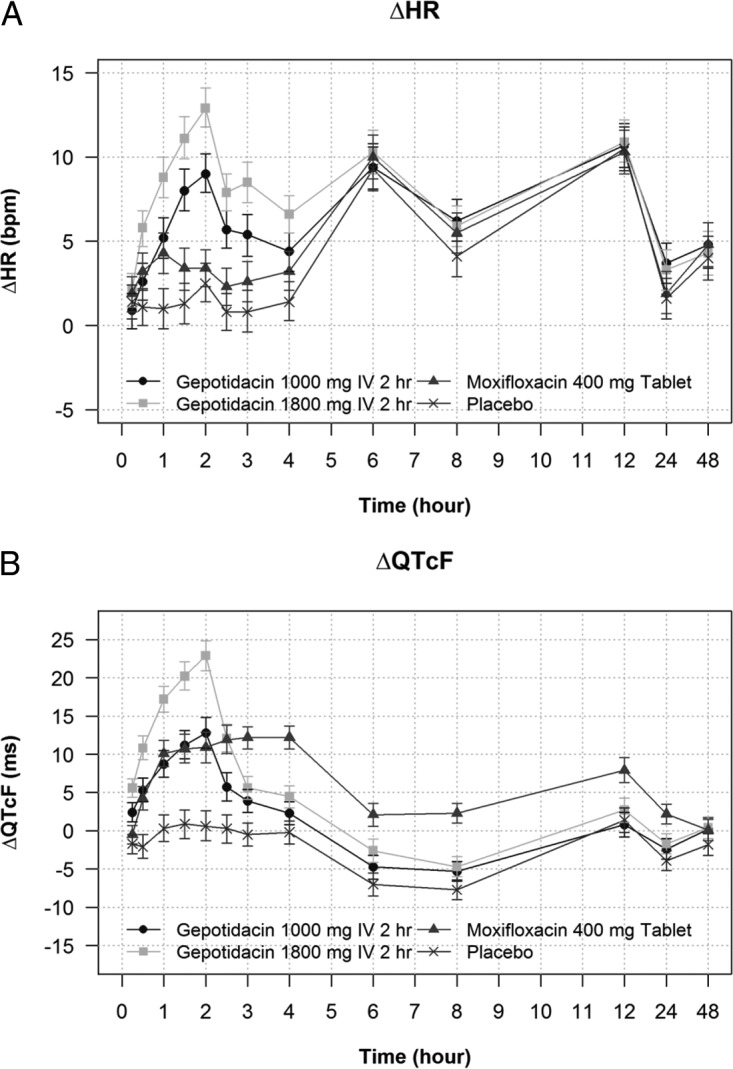
FIG 2.

(A) Change-from-baseline heart rate (ΔHR) across treatments and time points. Least-squares means and 90% CI from the statistical modeling are shown. (B) Change-from-baseline QTcF (ΔQTcF) across treatments and time points. Least-squares means and 90% CI from the statistical modeling are shown.
