
FIG 3.
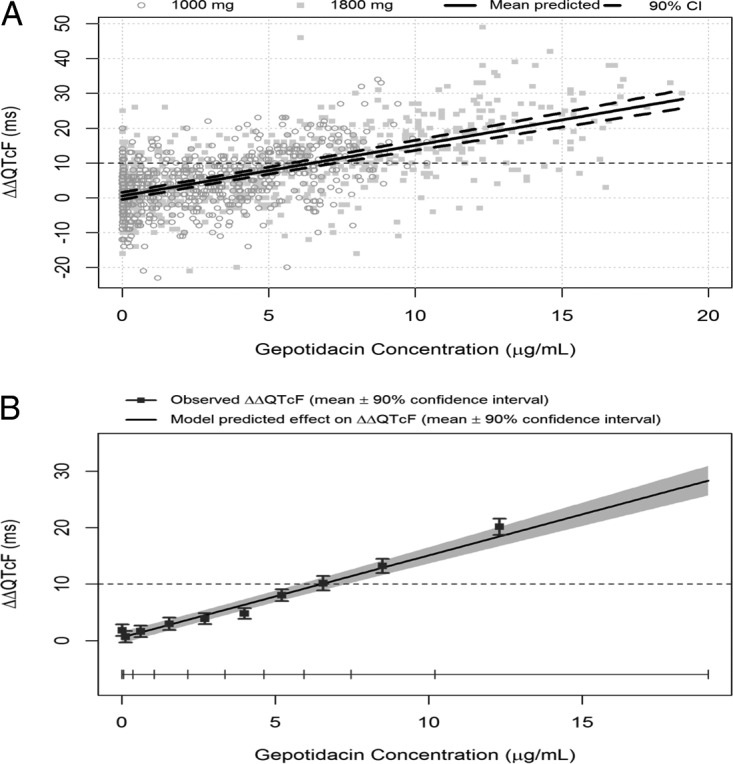
Relationship between gepotidacin plasma concentrations and placebo-corrected change-from-baseline QTcF (ΔΔQTcF). (A) Scatter plot with all observed ΔΔQTcF/plasma concentration pairs and exposure-response model predicted effect (red line) with 90% CI. (B) Exposure-response model-predicted ΔΔQTcF (means and 90% CI) and observed ΔΔQTcF (means with 90% CI) within each gepotidacin plasma concentration decile.