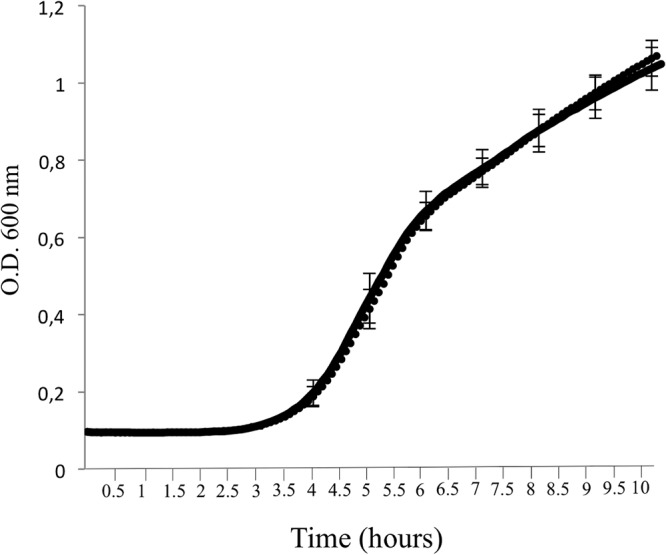
FIG 4.

Growth curves of E. coli strains in LB. Growth of E. coli ErtS (in dotted line) and E. coli ErtR (in solid line). The lines are surperimposed. The error bars indicate the standard deviations of the means for five experiments. Values of the optical density (O.D.) at 600 nm were collected every 5 min. The maximum growth rate (MGR) of E. coli ErtS was 1.45 ± 0.12 h−1, whereas the MGR of E. coli ErtR was 1.46 ± 0.14 h−1.
