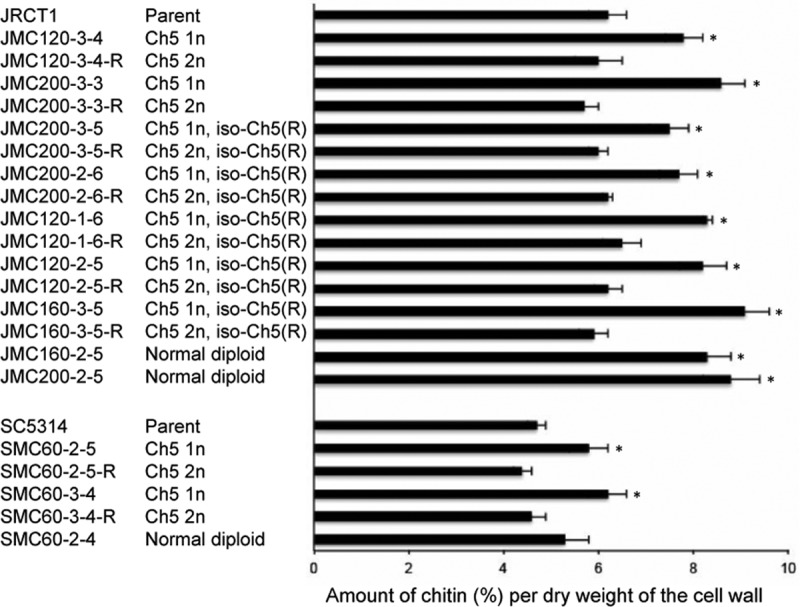
FIG 6.

Comparative levels of cell wall chitin in various strains. The data shown are for 9 representative sets of sequential derivatives, i.e., parental disomic Ch5 → aneuploid Ch5 → duplicated Ch5 (marked with “R”), as well as 3 representative mutants that kept a normal diploid genome. In some series, one Ch5 was combined with one iso-Ch5R, as indicated on the left. The Ch5 condition is also indicated on the left (2n or 1n for two or one Ch5 copy, respectively). Strains are indicated on the left. The test was conducted in triplicate. Error bars are shown. The differences between parental strains and their derivatives were evaluated by use of Student's t test. Derivatives showing statistically significant differences, with P values of <0.05, are marked with asterisks.
