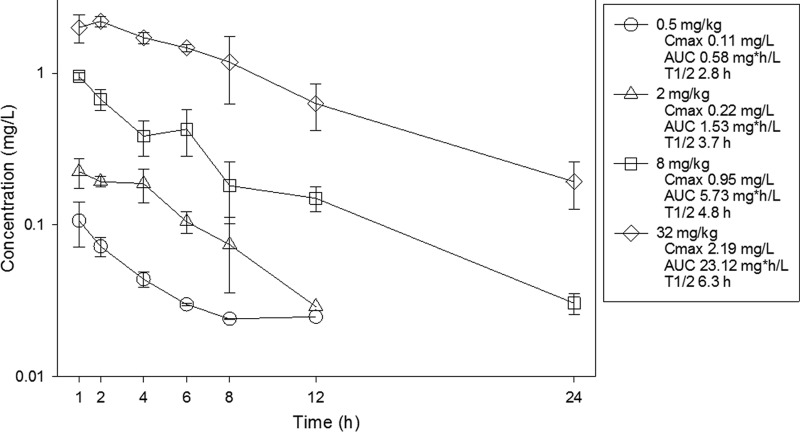
FIG 1.
Plasma concentrations of omadacycline in mice following single subcutaneous doses. Samples were obtained at seven time points over 24 h. Each symbol represents the mean and standard deviation from three mice. Cmax, peak concentration; t1/2, beta elimination half-life. The AUC is from 0 to infinity.

