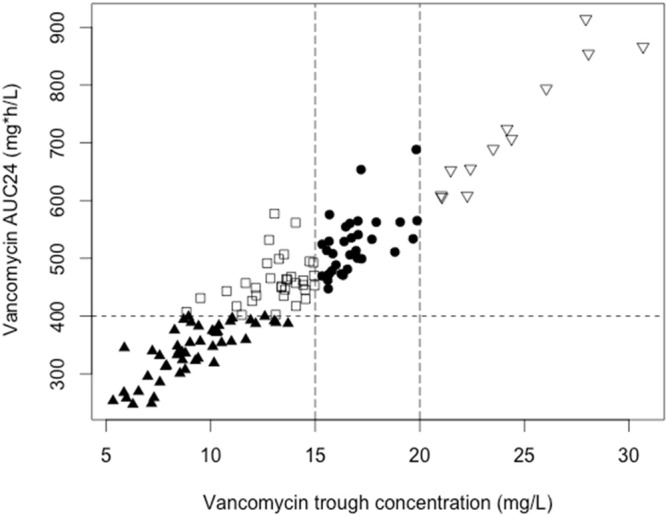
FIG 1.

Scatterplot of vancomycin measured trough concentrations and AUC0–24. Vertical and horizontal lines represent current recommended vancomycin trough and AUC24 targets (Spearman rho, 0.923) for clinical efficacy. Shapes represent whether patients achieved AUC0–24 and/or appropriate trough thresholds (i.e., open squares represent patient measurements which achieved AUC0–24 targets but not trough targets).
