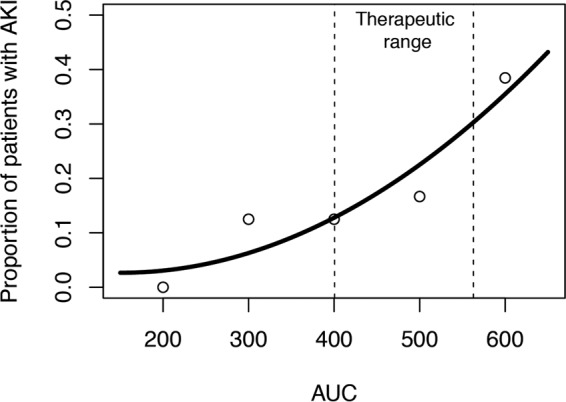
FIG 3.

Vancomycin exposure-toxicity curve. Relationship between risk of acute kidney injury (AKI) and vancomycin AUC0–24 is represented by best-fit curve (open circles represented raw data at various AUC0–24 strata). The CART threshold is reflected by the vertical dashed lines and translates into a therapeutic vancomycin AUC0–24 range of 400 to 563.
