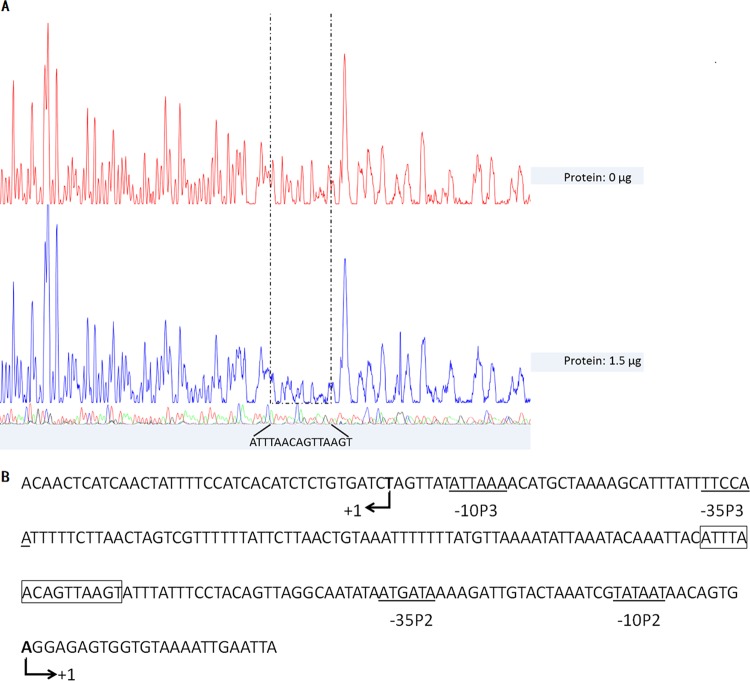
FIG 4.
Identification of VraR binding sequences. (A) DNase I footprinting analysis of the agr promoter with VraR. (B) agr promoter sequence with a summary of the DNase I footprinting assay results. The −10 and −35 promoter regions are indicated by solid lines below the sequence. VraR-protected regions are in solid boxes. The translational start site is indicated by an angled arrow, and the corresponding nucleotide is in boldface.

