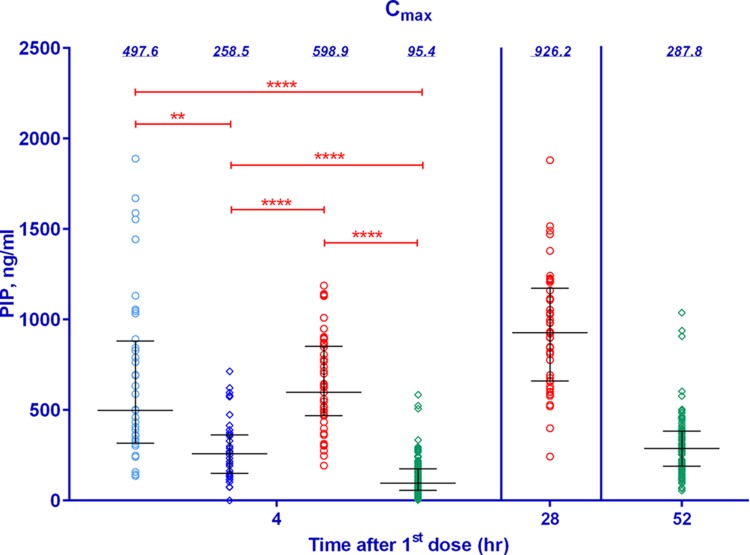
FIG 1.
Plots of observed maximum concentrations of piperaquine from three clinical studies evaluating DP (2010 to 2013). Blue, red, and green symbols, data from the 2010, 2012, and 2013 studies, respectively; circles, 2DP regimen; diamonds, 3DP regimen; horizontal bars, median and interquartile ranges; value above each column, the median piperaquine concentration; red bars above the columns, individual comparisons of statistical significance (**, significant differences [P < 0.01]; ****, very highly significant differences [P < 0.0001]).

