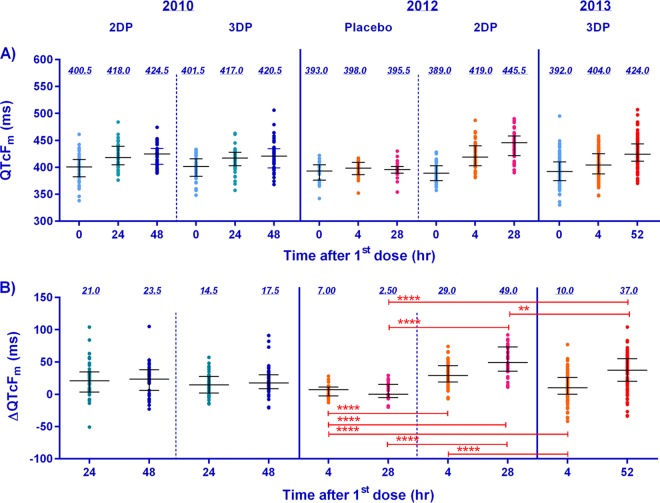
FIG 2.
Plots of the medians and interquartile ranges of the observed QTcFm at 0, 24, 48, and 52 h after the first dose of DP or placebo (A) and the change in QTcFm over the baseline at 4, 24, 28, 48, and 52 h after the first dose (B) from the three clinical trials conducted between 2010 and 2013 in northern Cambodia. Light blue, orange, green, pink, dark blue, and red, data for times of 0, 4, 24, 28, 48, and 52 h after the first dose, respectively; horizontal bars, median and interquartile ranges; value above each column, median; red bars above the columns, individual comparisons of statistical significance (**, significant differences [P < 0.01]; ****, very highly significant differences [P < 0.0001]). Note that the volunteers in the 2010 and 2013 studies were treated for uncomplicated malaria, while those in the 2012 study were healthy volunteers administered DP as prophylaxis. The 2010 study collected trough drug levels and EKG results only at 24 and 48 h postdosing.

