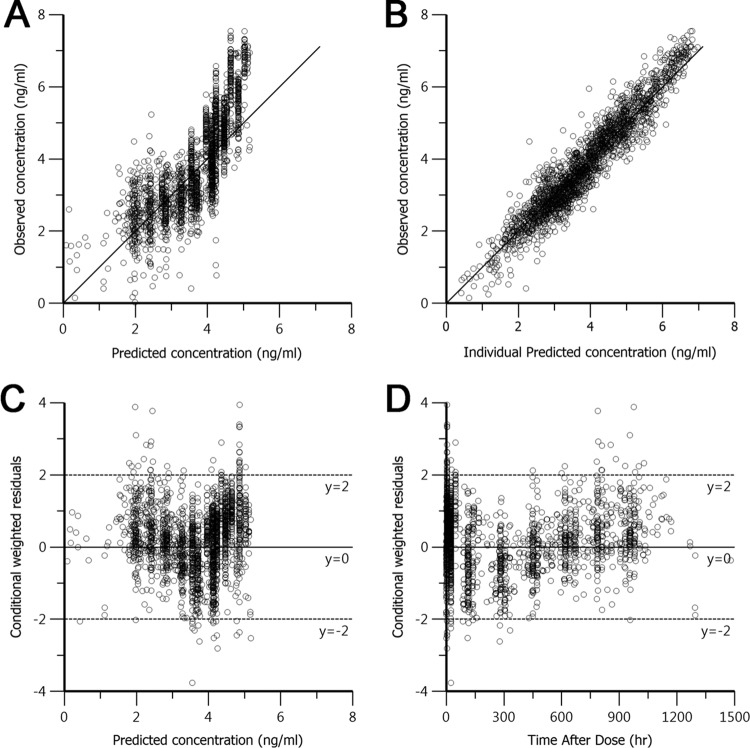
FIG 3.
Basic goodness-of-fit plots for the final piperaquine population model. (A, B) Observed concentrations were plotted against population predicted natural logarithm-transformed concentrations (A) and against individual predicted concentrations (B) and compared to the line of identity (solid line). (C, D) Conditional weighted residuals were plotted against population predicted concentrations (C) and the time after dose administration (D).

