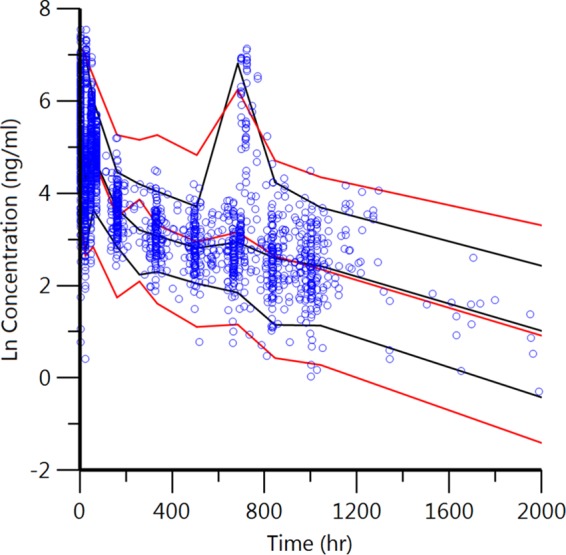
FIG 4.

Visual predictive check of the final piperaquine model. Circles, observed data; red and black lines, 5th, 50th, and 95th percentiles of the observed and predicted data, respectively. The concentrations were transformed into their natural logarithms. The second peak at about 720 h (30 days) represents the second month of dosing from the DP prophylaxis study in 2012 in a small subset of subjects.
