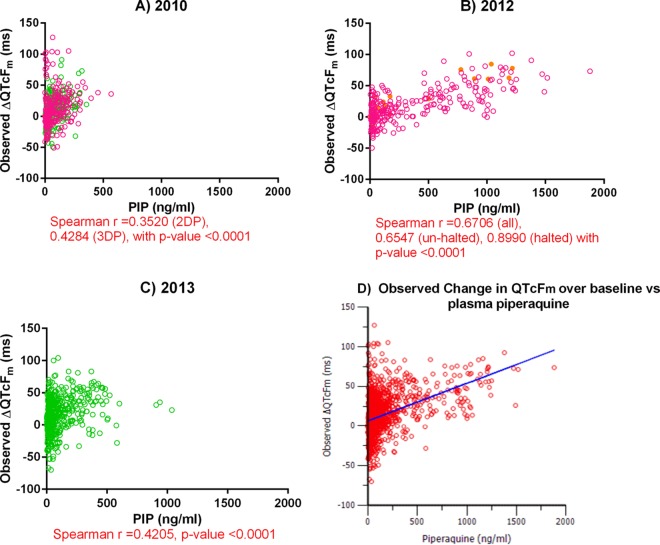
FIG 5.
(A to C) Plots of the plasma piperaquine concentration versus ΔQTcFm over the QTcFm at the baseline. Pink, green, and yellow circles, results for volunteers receiving the normal 2DP regimen, volunteers receiving the normal 3DP regimen, and volunteers who were stopped from participating in the study, respectively. (D) Plot of the overall observed change in QTcFm over that at the baseline versus the plasma piperaquine concentration from linear slope-intercept modeling. Red circles, observed data; blue line, predicted values. The slope estimate was 0.05 ms per ng/ml of piperaquine (RSE = 5.26%) with a baseline intercept of 6.55 ms (RSE = 10.1%) and a standard deviation for the additive residual error of 22.4.

