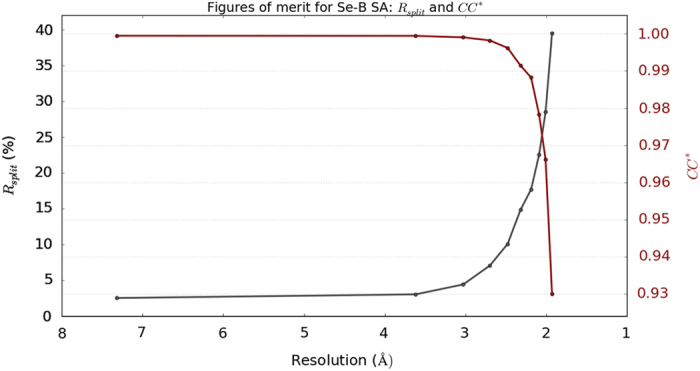
Figure 4. Figures of merit plot: CC* (red) and Rsplit (blue) versus resolution.

CC* is an estimate of the cross correlation between the observed dataset against the unmeasured true intensities which is above 90% for our dataset up to the observed resolution shell. Rsplit is a measure of discrepancy of the measured intensities and it stays below 40% for our dataset up to the observed resolution shell. Both plots indicate the merged intensities are of high quality.
