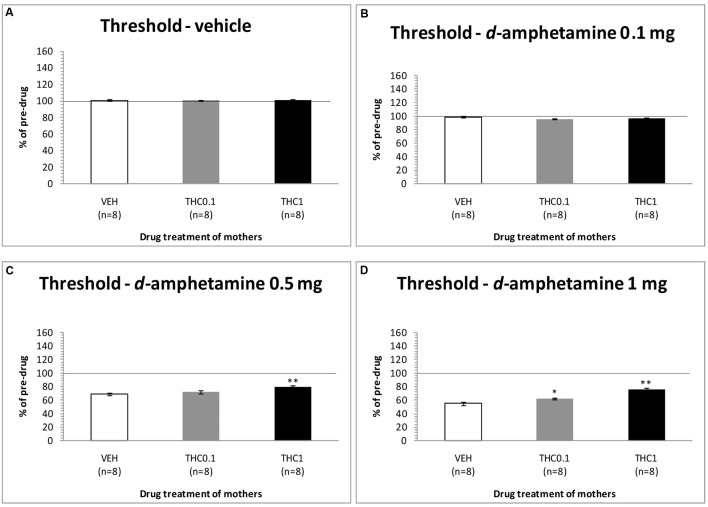
FIGURE 4.
Changes in self-stimulation threshold in F1 animals, expressed as percentage of predrug value, following acute i.p. administration of 0 mg/kg (A), 0.1 mg/kg (B), 0.5 mg/kg (C), and 1 mg/kg (D) of d-amphetamine. Horizontal axes represent the three groups of F1 animals. The asterisk (∗) signifies a statistically significant effect compared to the vehicle group (F1 of F0-VEH animals), ∗p < 0.05 and ∗∗p < 0.01.

