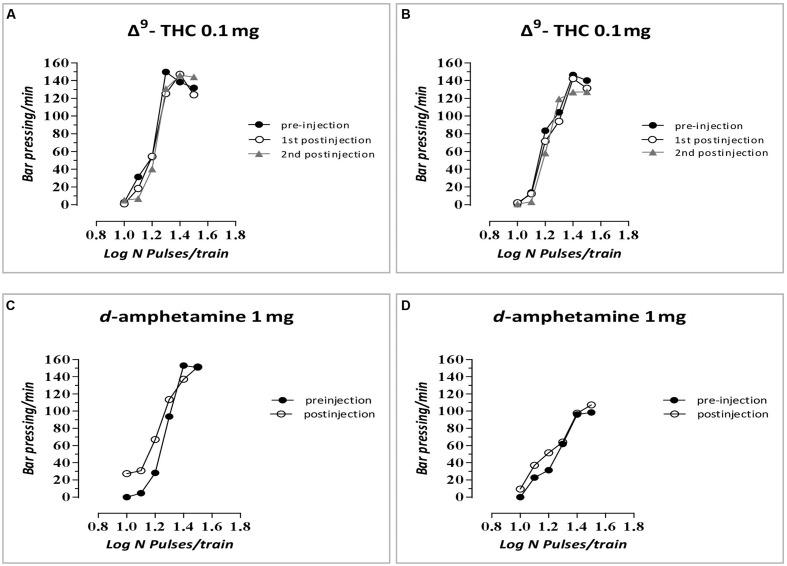
FIGURE 6.
Rate-frequency functions (rate of lever pressing as a function of stimulation frequency) taken from representative F1 animals. Each plot represents data from a single animal under predrug and drug conditions. Rate frequency functions were obtained by logarithmically decreasing the frequency of the stimulation pulses from a value that sustained maximal lever pressing to one that failed to sustain lever pressing. (A) Mother treatment Δ9-THC 0.1 mg/F1 animal treatment Δ9-THC 0.1 mg, (B) mother treatment Δ9-THC 1 mg/F1 animal treatment Δ9-THC 0.1 mg, (C) mother treatment Δ9-THC 0.1 mg/F1 animal treatment d-amphetamine 1 mg, and (D) mother treatment Δ9-THC 1 mg/F1 animal treatment d-amphetamine 1 mg.

