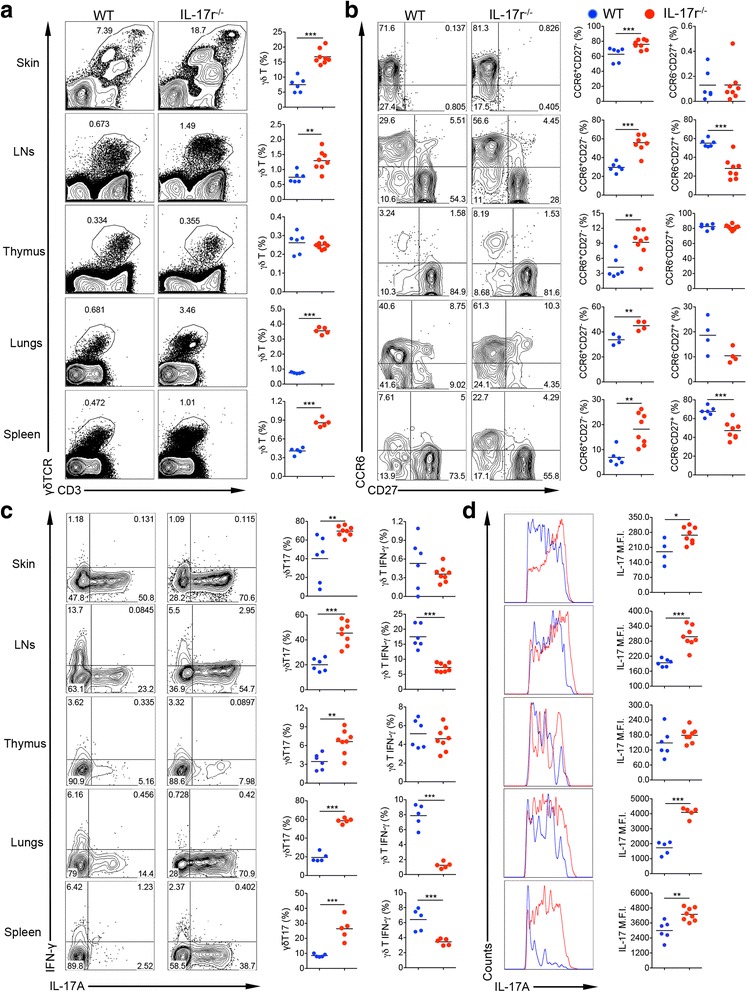
Fig. 1.

γδT17 cell expansion in mice deficient in IL-17 receptor. Flow cytometry studies staining homogenous tissue samples from different organs from IL-17r−/− mice and WT mice of similar age and sex from the same facility. a Gating from the total live lymphocyte population then gated on CD3 versus γδTCR for total γδ T cell percentage in each tissue. Plots representative of seven to eight experiments. **p < 0.01, ***p < 0.001. b Gating from total γδ T cells then looking at CCR6 versus CD27 in each tissue to calculate CCR6+CD27− (IL-17-capable γδ T cells) and CCR6−CD27+ (IFN-γ-capable γδ T cells). Plots representative of three experiments. **p < 0.01, ***p < 0.001. c Gated on total γδ T cells stimulated with PMA/Ionomycin for 5 h to calculate IL-17- or IFN-γ-producing γδ T cells. Figures representative of seven to eight experiments. **p < 0.01, ***p < 0.001. d Gated on IL-17-producing γδ T cells from IL-17r−/− (red) and WT mice (blue) to compare mean fluorescence intensity (MFI) of IL-17 production level on a per cell basis. Histograms representative of seven to eight experiments. *p < 0.05, **p < 0.01, ***p < 0.001
