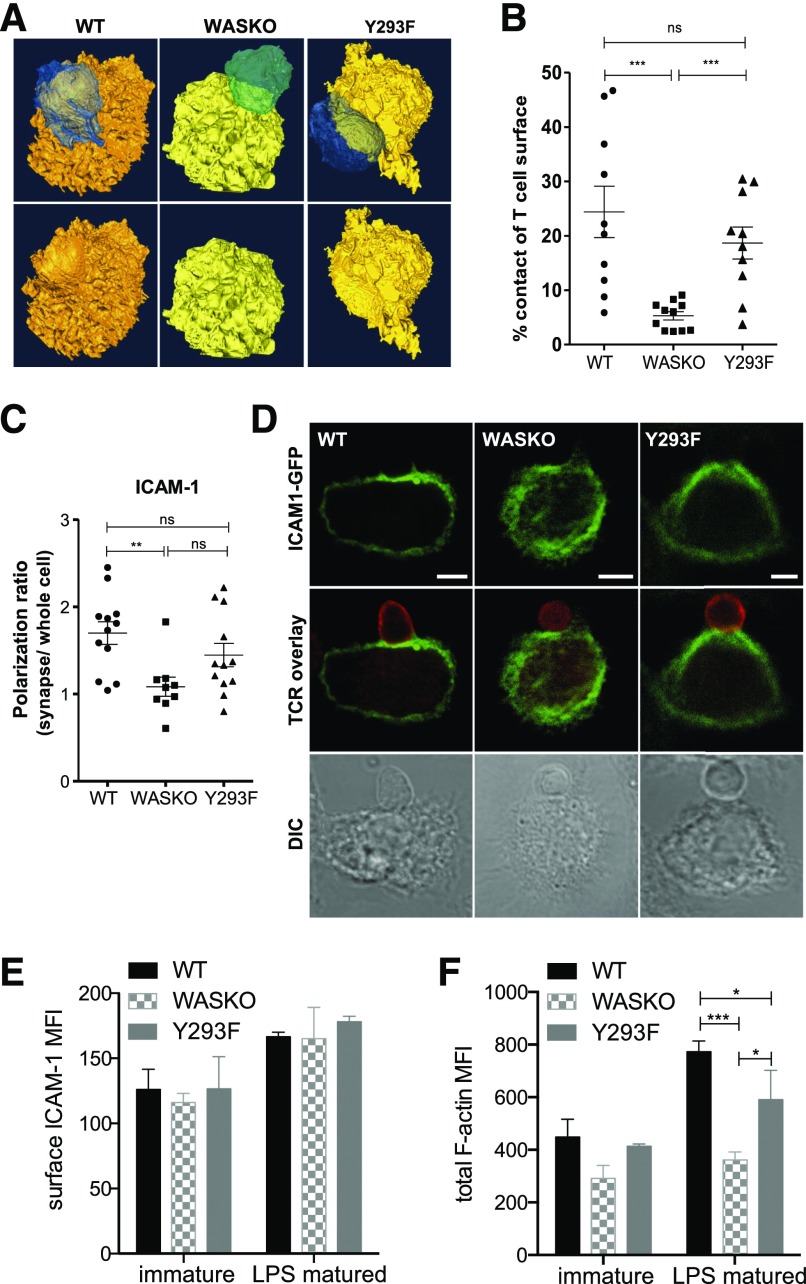
Figure 1. The WASp-dependent DC actin cytoskeleton contributes to correct organization of adhesion molecules and formation of an extensive cell:cell contact.
(A) WT, WASKO, and Y293F DCs (yellow/orange), pulsed with OVA, were cocultured with OT-II T cells (blue/green). After 1 h, conjugates were fixed, processed, and imaged using Gatan 3View. Isosurface reconstructions were created in Amira. (Lower) Conjugates with T cell removed to visualize the contact interface. (B) Quantification of DC:T cell contact surface area as a percentage of T cell surface. A minimum of 10 conjugates was analyzed per group. Unpaired t test was used to test significance among DC types; ***P(WT + WASKO) = 0.0005, P(WASKO + Y293F) = 0.0002; ns P(WT + Y293F) = 0.3153. (C and D) DCs expressing ICAM-1-GFP (green) were cocultured with T cells (red; anti-TCR immunostain) for 45 min and fixed. Images represent a slice cutting through the synapse. Polarization ratios of ICAM-1 on the DC side were calculated by measuring fluorescence intensity at the synapse normalized to whole cell. Original scale bars, 5 μm. Unpaired t test was used to test significance among DC types; **P(WT + WASKO) = 0.0026; ns, P(WT + Y293F) = 0.1875, P(WASKO + Y293F) = 0.0610. DIC, Differential interference contrast. (E) Total surface ICAM-1 was measured by flow cytometry in immature and LPS-matured BMDCs, gated on CD11c-positive cells. Means and sd are shown from 3 independent experiments. MFI, Mean fluorescence intensity. (F) Total polymerized actin was measured using phalloidin in permeabilized, immature and LPS-matured BMDCs. Staining was performed in mixed population samples using CFSE labeling. Bars represent means and sd from 3 experiments. ***P(WT + WASKO) = 0.0010, *P(WT + Y293F) = 0.0472, *P(WASKO + Y293F) = 0.0407.

