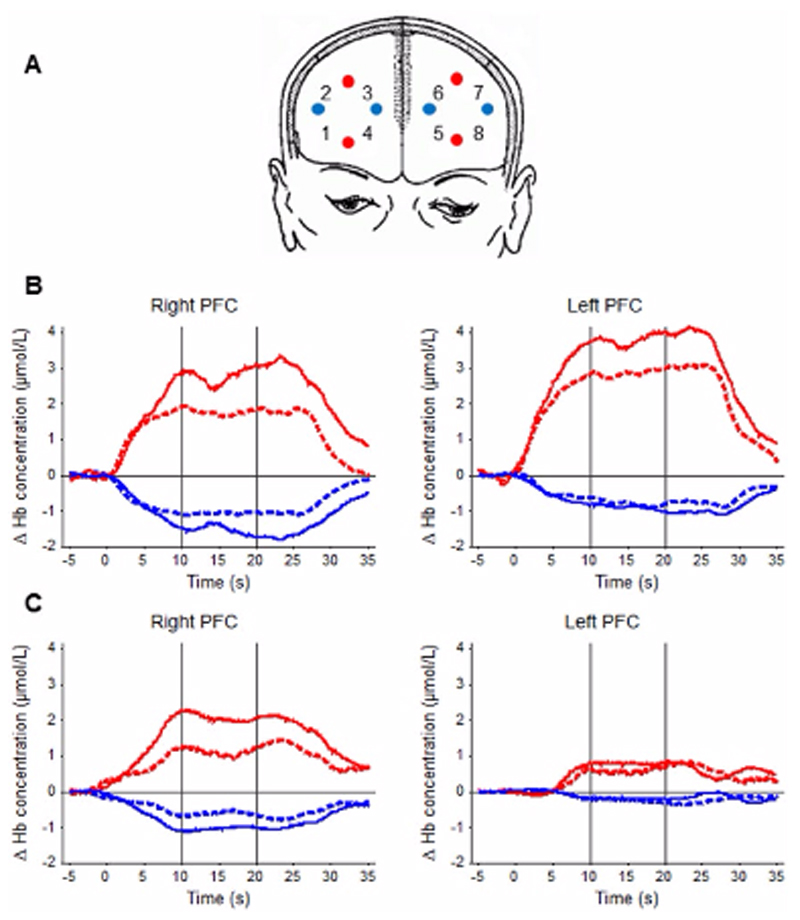
Figure 2.
Near-infrared spectroscopy (NIRS) measurement: (A) Schematic representation of NIRS probe location. The red (transmitters) and blue (detectors) circles indicate positions of optodes. Numbers indicate the positions of channels defined as a midway between neighboring transmitter-detector pairs. The probe holder covered the area linking Fp1, F3, and F7 and the area linking Fp2, F4, and F8 according to the international 10-20 electroencephalography (EEG) system, which is correspondent to the left and right prefrontal cortex (PFC), respectively. (B and C) Representative examples of PFC activation in a stroke patient (B) and a healthy control (C) under single task (ST; dashed lines) and dual task (DT; solid lines) walking. Time course of the grand average across all blocks averaged over all measured probe positions (left and right PFC). The y-axis displays relative concentration changes of hemoglobin in millimoles per liter. The increase in [oxy-Hb] is indicated by the red line, the decrease in [deoxy-Hb] by the blue line. Vertical lines across the graphs indicate the 10-second time window used for further statistical analysis.

