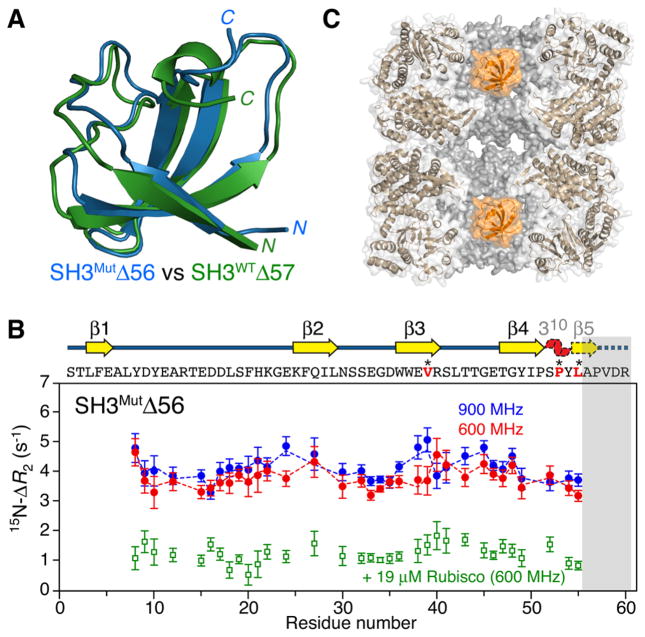
Figure 1.
Interaction of SH3MutΔ56 with apo GroEL. (A) Ribbon diagrams showing a superposition of the structures of SH3MutΔ56 (blue) and SH3WTΔ57 (green), representing mimetics of a folding intermediate of the Fyn SH3 domain, determined from backbone chemical shifts and residual dipolar couplings using CS-Rosetta9 (see the Supporting Information and Figures S2 and S3). (B) 15N ΔR2 observed for 100 μM 15N-labeled SH3MutΔ56 in the presence of 120 μM (in subunits) apo GroEL at 900 MHz (blue circles) and 600 MHz (red circles) and 10 °C. The dashed lines represent the best fits obtained by simultaneously fitting all relaxation data (ΔR2, DEST, and relaxation dispersion) to the model shown in Figure 3. The ΔR2 effect is essentially abolished when the GroEL cavity is blocked by acid-denatured Rubisco (green circles). The gray bar indicates the residues deleted in SH3MutΔ56. The sequence (residues in red are sites of mutations) and secondary structure are shown above the panel; the 310 helix and β5 (dashed outline) are unfolded in SH3MutΔ56, but only β5 is unfolded in SH3WTΔ57 (see panel A). Error bars are one standard deviation. (C) Cross section through apo GroEL (Protein Data Bank entry 3E7610) illustrating the two cavities with a SH3MutΔ56 molecule (orange, space-filling model) confined in each cavity.

