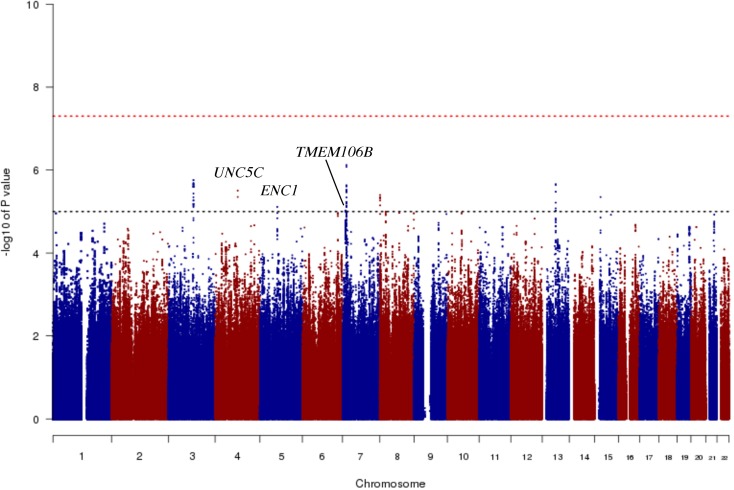
Fig 1. Manhattan plot from the genome-wide association study for residual cognition.
In this plot, we present the results for each SNP tested in the genome-wide association study that included 979 participants from the Religious Orders Study and the Rush Memory and Aging Project. Each point is one SNP. The x-axis denotes the physical position of the SNP, and the y-axis reports −log(p-value) for each SNP. The threshold for a suggestive association (p < 10−5) is denoted by the black dotted line and identifies those loci that were considered in step 2 of our analysis. The red dotted line denotes the threshold of genome-wide significance. The three loci considered in step 2 are highlighted: UNC5C, ENC1, and TMEM106B.

