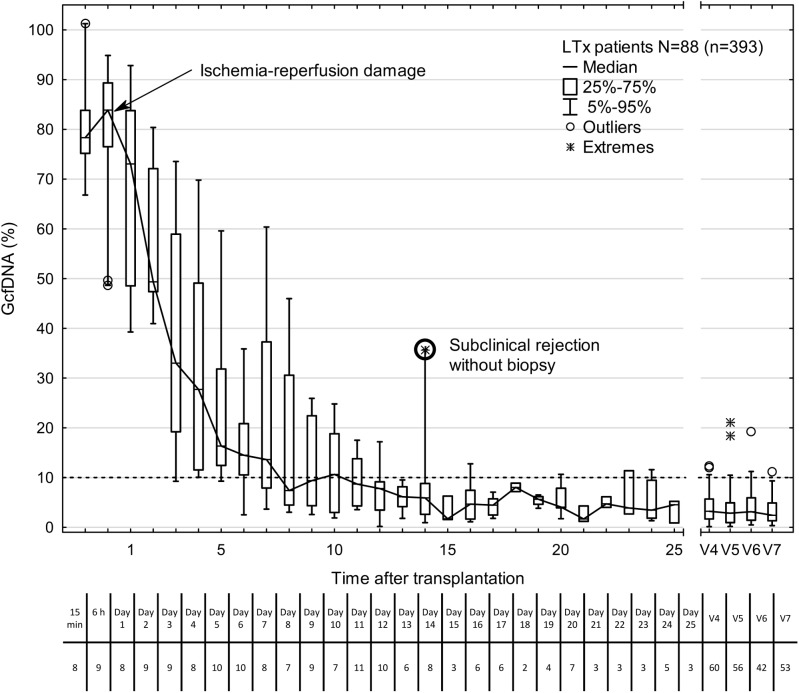
Fig 2. Time course of plasma GcfDNA percentage during the first year after liver transplantation in patients without rejection, active infections, or interventions.
Boxes represent median with interquartile range, with whiskers showing the 5th–95th percentile. V4, 2–4 mo; V5, 4–8 mo; V6, 8–10 mo; and V7, 10–14 mo. The number of samples is given below each time point. The bold circle represents one patient with subclinical rejection without biopsy 1 wk earlier (see text). GcfDNA, graft-derived cell-free DNA; LTx, liver transplantation.

