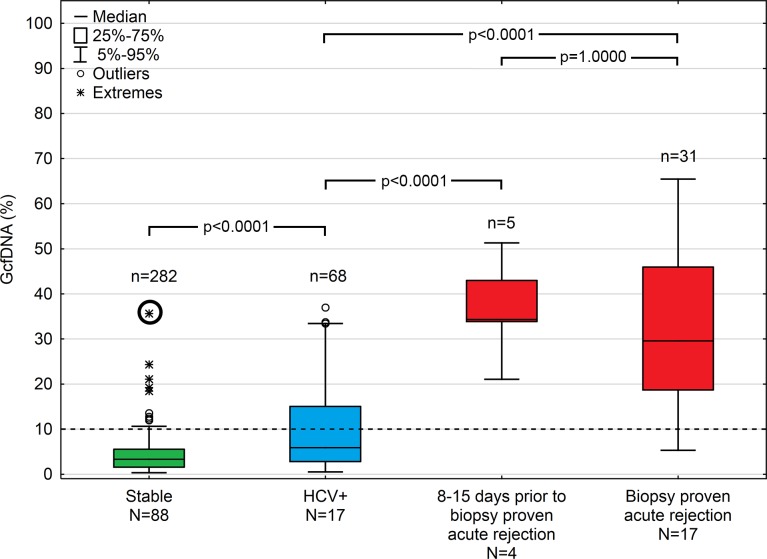
Fig 3. Plasma GcfDNA percentages during the first year after transplantation in stable patients and patients with either HCV or biopsy-proven acute rejection.
Boxes represent median with interquartile range, with whiskers showing the 5th–95th percentile and n’s showing the number of contributing values. The bold circle represents the patient with subclinical rejection without biopsy 1 wk earlier (see text). GcfDNA, graft-derived cell-free DNA; HCV, hepatitis C virus.

