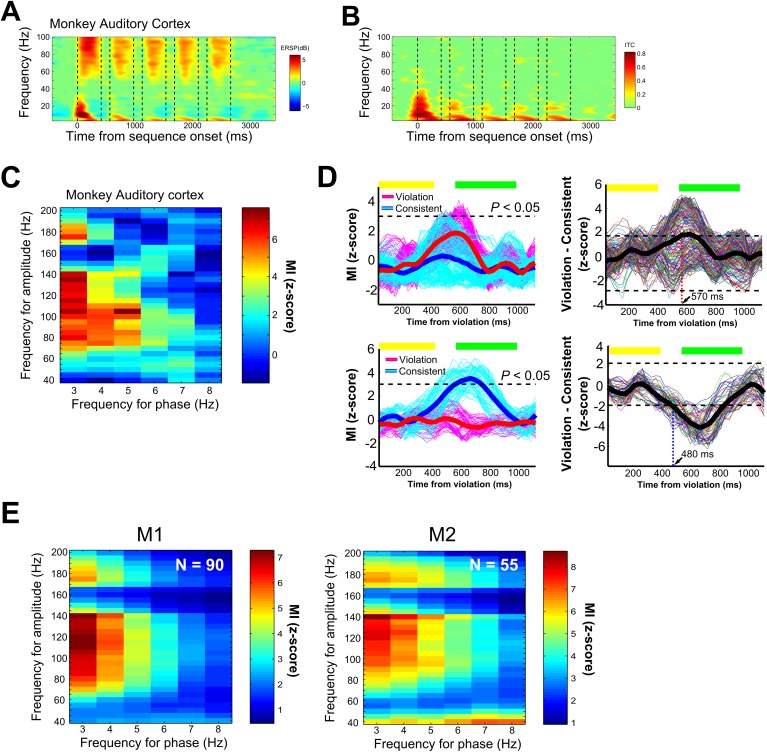
Fig 2. Monkey phase–amplitude coupling in response to the nonsense words and between-word transitions.
A. Time-frequency representation of local field potential (LFP) cortical responses in the monkey auditory cortex to the nonsense words (all eight sequences). Shown is the event-related spectral perturbation (ERSP). The color scale indicates power (in dB) at a given frequency and time relative to the 500-ms baseline prior to sequence onset. B. Phase consistency was calculated using intertrial phase coherence (ITC). Bootstrap statistics (p < 0.01) were computed using the same baseline used to calculate the ERSP, and nonsignificant points were colored in green for both ERSP and ITC. C. Exemplary phase–amplitude coupling (PAC) in response to the nonsense words for the same data shown in (A) and (B). The MI values were z-scaled and shown at each combination of frequency for phase in the x-axis and frequency of amplitude in the y-axis. D. The left panels show the modulation index (MI) time course of PAC during the analysis window, extracted from the combinations of amplitude and phase pairs in response to the nonsense words that were above the statistical threshold (p < 0.05, Bonferroni correction). The results shown here are for the same exemplary LFP site shown in A–C. The thick lines denote the average PAC response across all significant phase and amplitude pairs, and the thin lines show the coupling strength for all phase–amplitude pairs. The horizontal yellow and green bars above the response curve identify the time of occurrence of the elements in the two types of sequences after the violation onset in the violation sequence or the acoustically identical elements in the corresponding consistent sequence. The right two panels show difference plots of the time course of oscillatory coupling in response to the violation versus the corresponding consistent sequence. The thick line denotes the average difference calculated from the data on the left. The horizontal dotted lines denote the CI significance threshold. The vertical dotted line identifies the latency of the first significant effect. The top panels show an exemplary response with a violation-preferring sequencing context effect. The bottom panels show exemplary response with a consistent-preferring sequencing context effect. E. Average PAC in response to the nonsense words across all LFP sites in the monkeys (145 LFPs, p < 0.05, Bonferroni-corrected).

