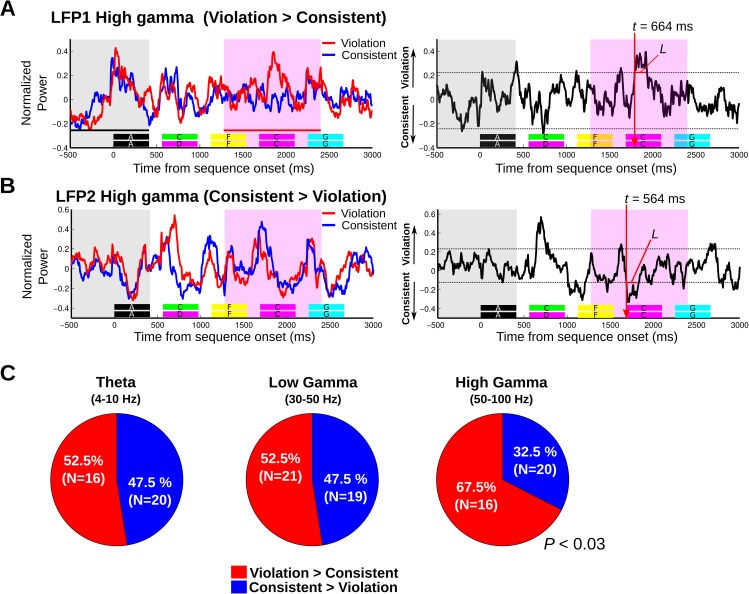
Fig 4. Exemplary monkey local field potential (LFP) response sensitivity to the sequencing context.
A. (left) An exemplary LFP high-gamma response (50–100 Hz) to consistent (blue line) and violation sequences (red line), showing greater response to the violation sequence during the probe stimulus analysis window (pink window in left panel). The horizontal color keys below the response curves indicate each element of the consistent and the violation sequences. The gray area indicates the 913-ms baseline period (i.e., 500 ms prior to the sequence onset through to the end of the first “A” element). (Right) a difference response waveform was created by subtracting the grand average response to the consistent sequence from the grand average response to the violation sequence (“violation”–“consistent”). “L” is the length of the sequencing context–dependent response (i.e., response duration breach above the CIs) and “t” is the sensitivity latency, which is defined as the first time point that breached the CI. Significance of breach is based on permutation tests using both duration and magnitude criteria (see Materials and methods). B. An exemplary LFP high-gamma response (50–100 Hz) that is greater for the consistent sequence. C. Proportions of responses to sequences showing significant effects to either the consistent or violation conditions, subdivided by different LFP frequency bands.

