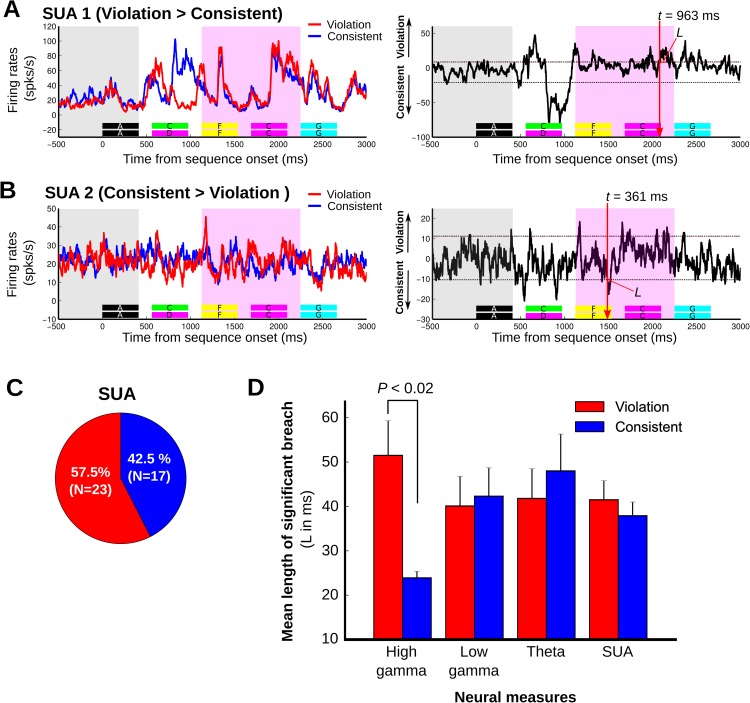
Fig 5. Exemplary monkey neuronal (single-unit activity [SUA]) response sensitivity to the sequencing context.
Figure format is the same as in Fig 4. A. Exemplary SUA showing significant response sensitivity to the violation sequence with a sensitivity latency of 963 ms (L = 77 ms). B. Exemplary SUA showing significant response sensitivity to the consistent sequence with a sensitivity latency at 361 ms (L = 36 ms). Note that peak differences in panels A–B occurring before these reported significant latencies were either not significant by the joint criterion of response magnitude and duration (Materials and methods) or occurred before the start of the analysis window and were thus not included for analysis. C. Proportions of neuronal responses to sequences showing significant effects in response to either the consistent or violation conditions. D. Magnitude of the context-dependent response to violation sequences (red) and consistent sequences (blue), measured as the length of time above the significance threshold (L) across different neural response measures: high-gamma (n = 40), low-gamma (n = 40), and theta (n = 36) local field potential (LFP) power, including SUA (n = 40). High gamma showed a significantly greater response magnitude to the violation sequencing context (p < 0.02). The vertical lines denote the standard deviation.

