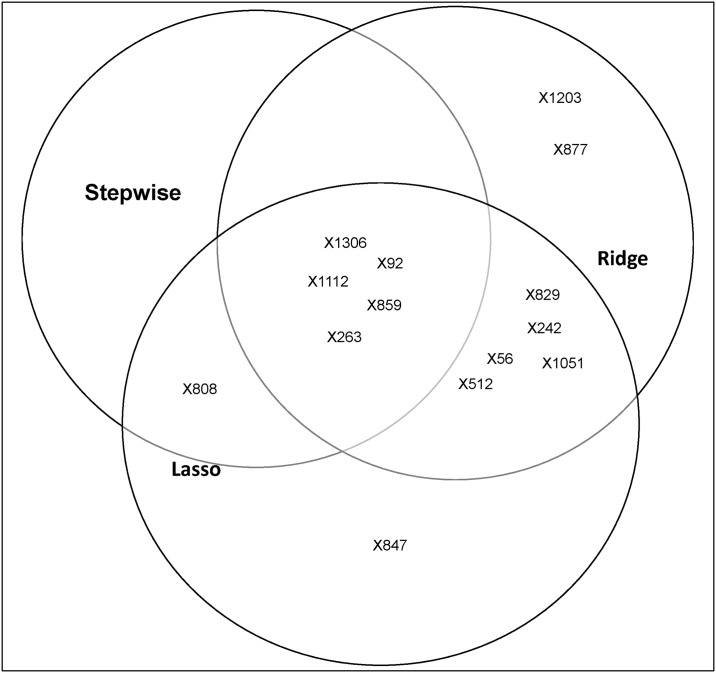
Fig 6. The visualisation of the selected key significant artificially simulated SNPs (intersection regions).
Xm represents the identifier of the simulated genotyped SNP m. Several simulated SNPs were consistently identified to be significant by the multiple methods as occurred in the actual SNPs data set.

