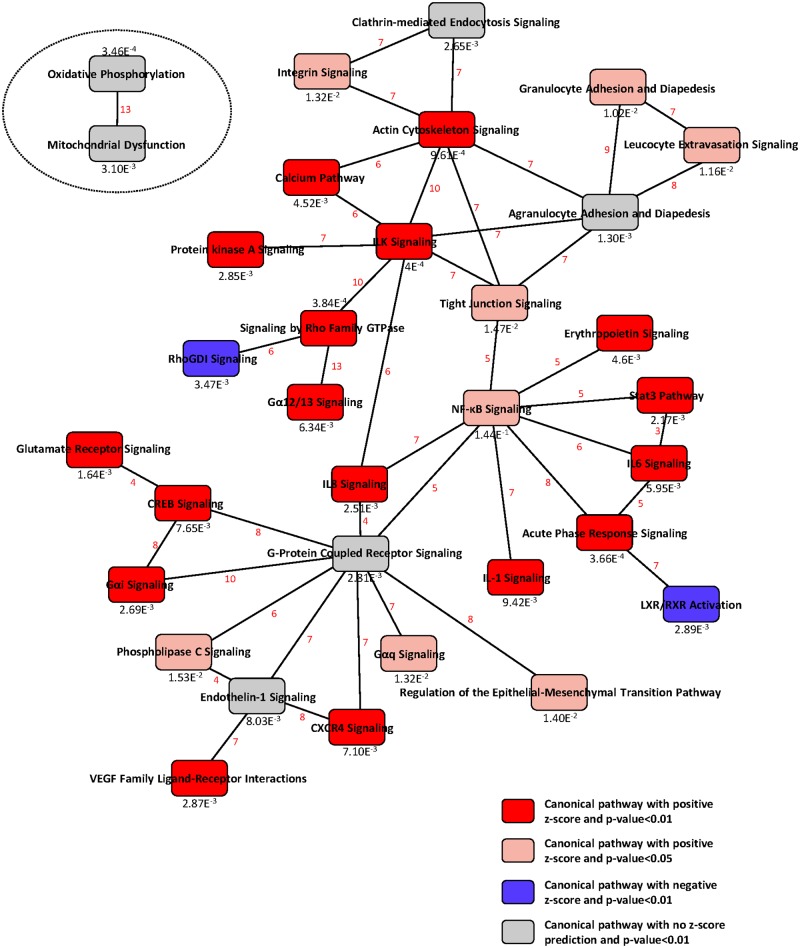
Fig 2. Functional relationships of pathways regulated during infection of CLEC213 with H6N2 virus.
IPA software was used to build a biological network using the DEG in the H6N2-infected cells compared with mock-infected controls (twofold change, p-value<0.01). Significance of the pathways are indicated at the bottom of each node. The diagram shows the interactions between pathways. Pathways are connected through common genes; the number of shared genes between pathways is indicated in red.

