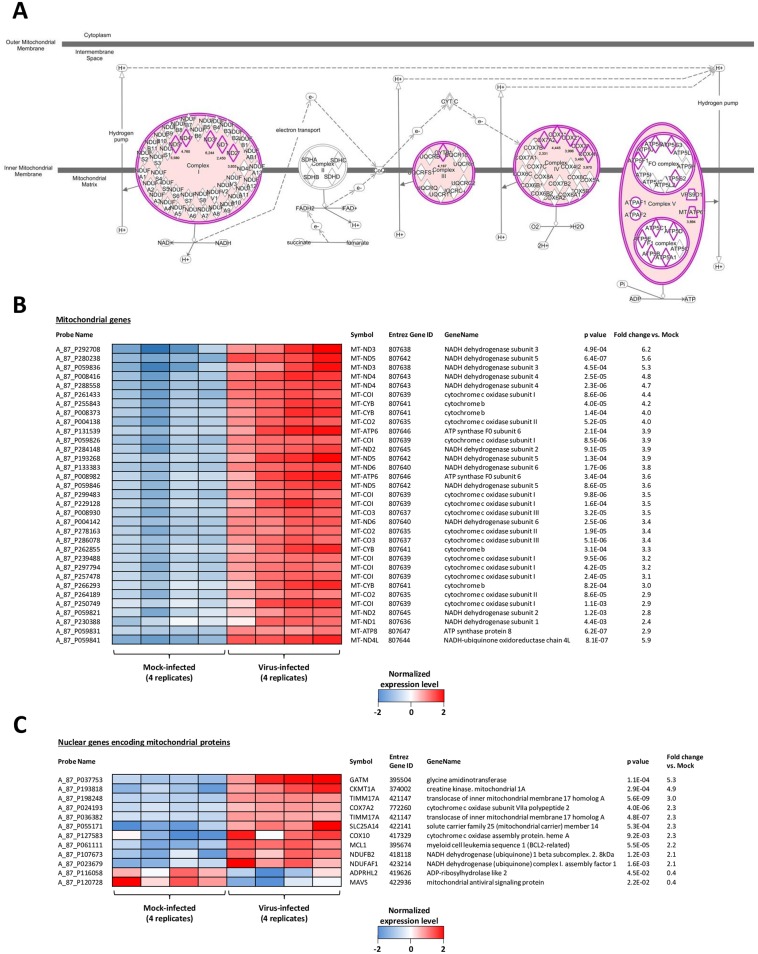
Fig 3. H6N2 infection impacts oxidative phosphorylation.
(A) Schematic representation of the “oxidative phosphorylation” metabolic pathway, constituted of 5 multiprotein complexes. The 4 complexes induced by AIV infection are colored in pink. The detail of the proteins composing the complexes is indicated, each induced gene is highlighted in pink and the fold induction is indicated. (B-C) Heat map showing the normalized level of expression of mitochondrial DEG encoded by the mitochondrial genome (B) or encoded by the cell genome (C). The four replicates of each condition (mock- and H6N2-infected) are represented.

