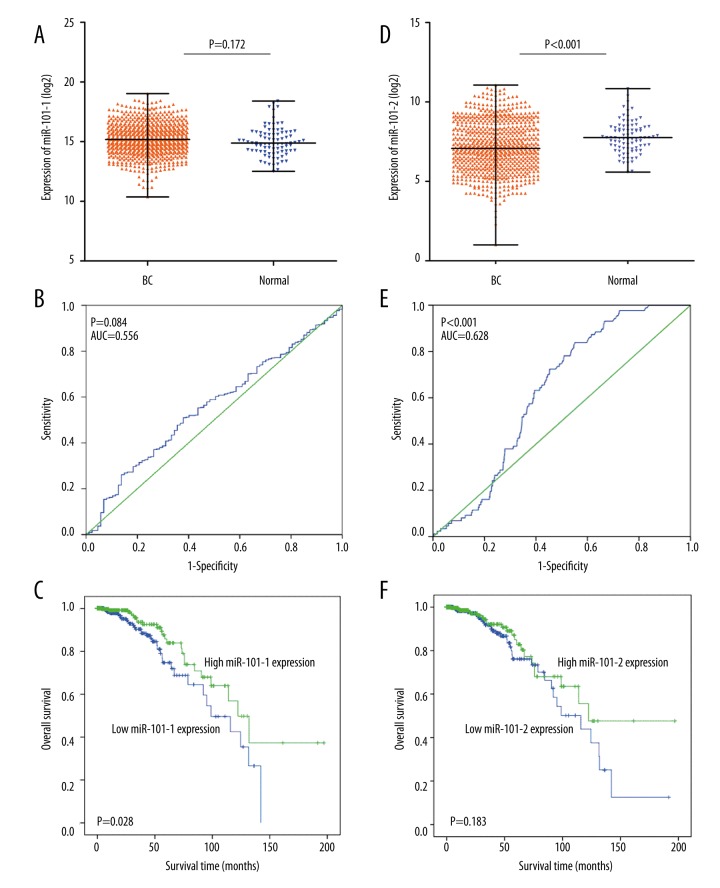
Figure 1.
The clinical significance of miR-101 in BC in TCGA data. (A), miR-101-1 expression in BC compared with the normal group; (B), ROC curve analysis of miR-101-1 for discriminating BC from normal breast tissues; (C), Kaplan-Meier survival curves showed that lower miR-101-1 expression was associated with worse prognosis of patients with BC; (D), miR-101-2 expression in BC compared with the normal group; (E), ROC curve analysis of miR-101-2 for discriminating BC from normal breast tissues; (F), Kaplan-Meier survival curves revealed the connection between miR-101-2 and the prognosis of patients with BC.

