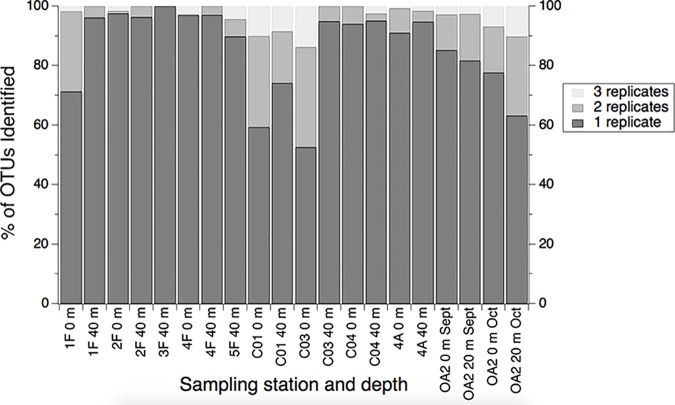
Fig 2. Percent of OTUs identified in 1, 2 or 3 of the biological replicates collected at each station/sampling depth.
Samples are labeled with station (i.e., 1F, 2F, etc.) followed by the sampling depth (i.e., 0 m, 20 m, 40 m). 3F-0 m and 5F-0 m are not shown because they do not have complete sets of three replicates after rarefying.

