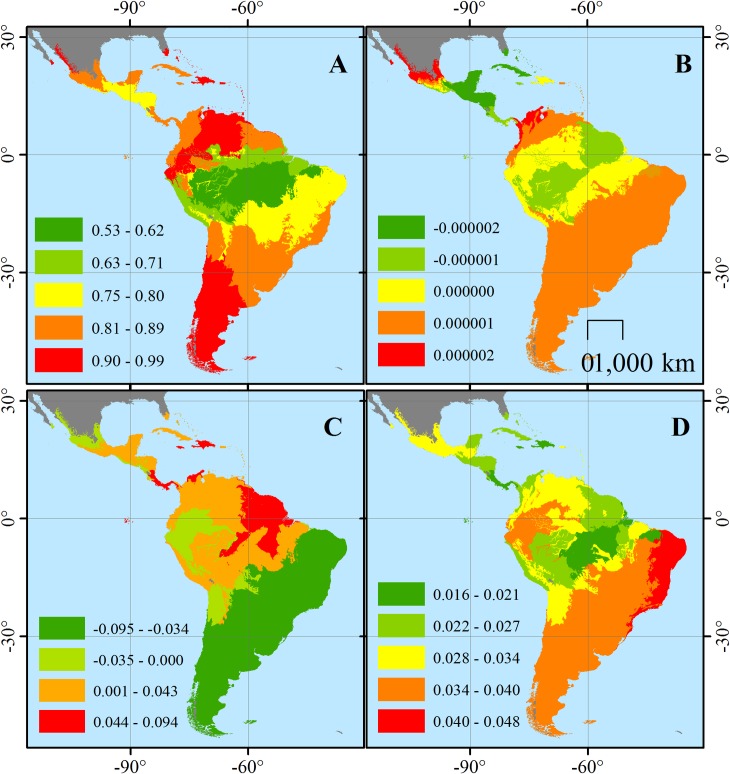
Fig 2.
Local values of (A) variation explained by selected variables–R2 and coefficients for (B) intervened land use, (C) threatened and (D) non-threatened species influencing mammal functional diversity for each ecoregion of the Neotropical realm based on a geographically weighted regression. Higher R2 values indicate higher functional diversity variation explained by the selected variables; higher coefficient value indicates higher positive influence of each variable while negative values indicate negative influence on functional diversity values.

