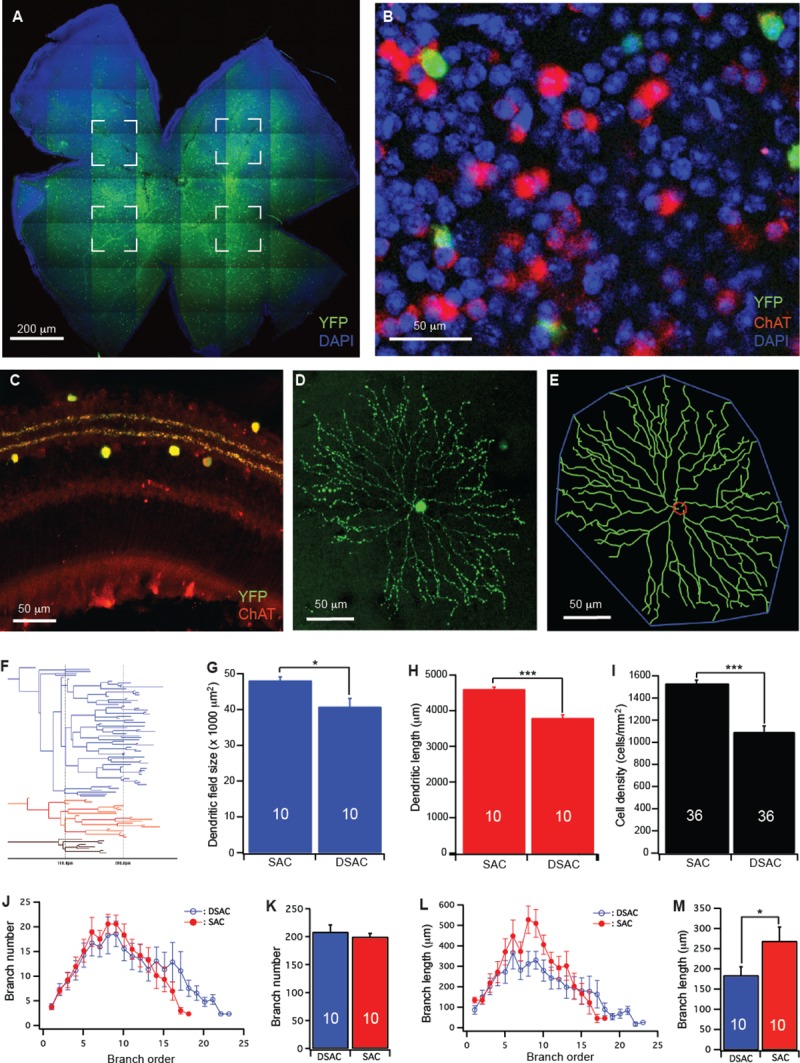
Fig 1. Quantify dendritic structure of mouse SACs/DSACs.

(A) Whole mount retina of a CreER-ChAT:Stop-YFP mouse stained with anti-GFP (green) and DAPI (blue). The four dashed-line boxes indicate the areas used for cell density calculation. (B) An enlarged area of the retinal ganglion cell layer showing YFP staining of Cre activated DSACs (green), anti-ChAT antibody staining of all DSACs (red) and DAPI (blue) staining of the GCL. (C) A cross section of the retina of a CreER-ChAT:Stop-YFP mouse showing YFP staining of Cre activated SACs and DSACs (green) and anti-ChAT antibody staining of SACs and DSACs (red) in the retina. (D) A maximum projection of the dendrites of a DSAC. (E) The tracing results of the DSAC shown in panel D (green, dendrites; red, soma; blue, dendritic field). (F) The dendrogram of the DSAC shown in panel D. The total length of dendrites, the number of dendritic branches, the order of each dendritic branch and the length of each dendritic branch were derived from this dendrogram. (G) Average size of dendritic field of SACs and DSACs. (H) Average length of dendrites of SACs and DSACs. (I) Average density of SACs and DSACs. (J) The number of dendritic branch as a function of dendritic order of SACs and DSACs. (K) The average number of dendritic branch of SACs and DSACs. (L) The length of dendritic branch as a function of dendritic order of SACs and DSACs. (M) The average length of dendritic branch of SACs and DSACs. The numbers in the columns of panels G, H, K and M indicate number of cells analyzed. The numbers in the columns of panel I indicate the numbers of images analyzed. In this figure and all following figures, * indicates 0.01<p<0.05; ** indicates 0.001<p<0.01; *** indicates p<0.001.
