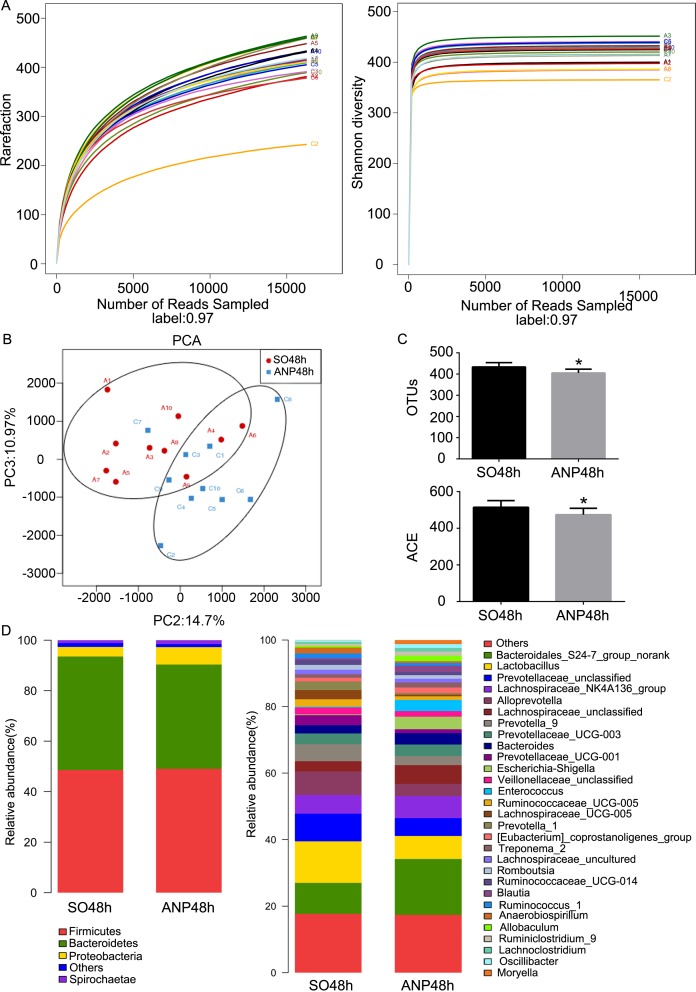
Fig 3. Changes in intestinal microbiota diversity and structure in ANP.
(A) Rarefaction curve and Shannon diversity curve of single sample in each group. (B) β-diversity comparison via PCA showed a separation between the SO48h and ANP48h groups. Principle components (PCs) 2 and 3 explained 14.7% and 10.97% of the variance respectively. Each symbol represents one sample. (C) The estimators of intestinal bacterial α-diversity in the SO48h and ANP48h groups. (D) Relative abundance of phyla and genera in intestinal microbiota of the two groups.

