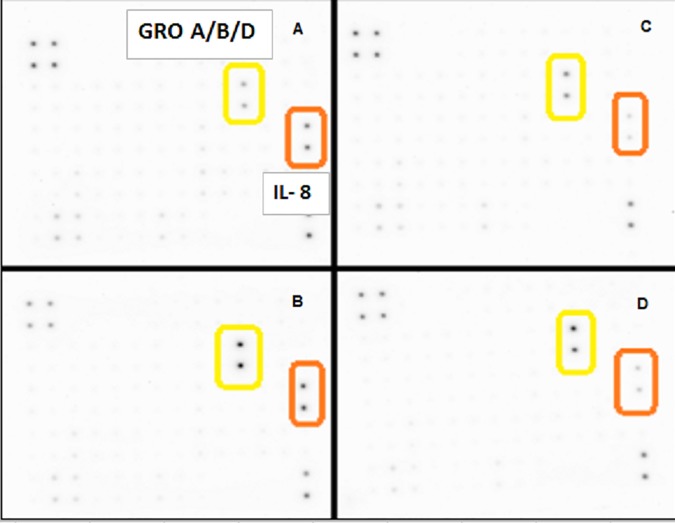
Fig 3.
(A-D). The release of cytokines as assessed using Human Cytokine Array C1000 membranes from MDA-MB-231 cells ± TNFα ± Apigenin. [A]Ctrls, [B]TNFα-treated (40ng/mL) [C]Apigenin (40μM) and [D]TNFα-treated (40ng/mL) + Apigenin (40μM) co-treated cells. The data present membrane spot densities (top) and manufacturer’s grid layout (bottom).

