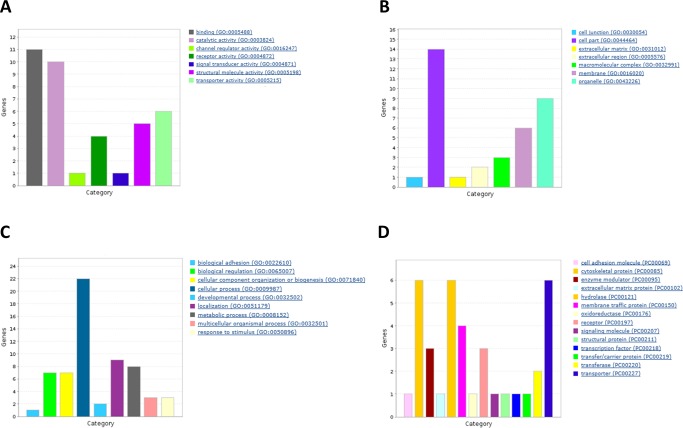
Fig 3.
Gene Ontology bar charts for three different criteria: biological process (A), cell localization (B) and molecular function (C). The list of differentially expressed genes after RSV diet in neocortex were classified by Gene Ontology (GO) and drawn using Panther (www.pantherdb.org/)

