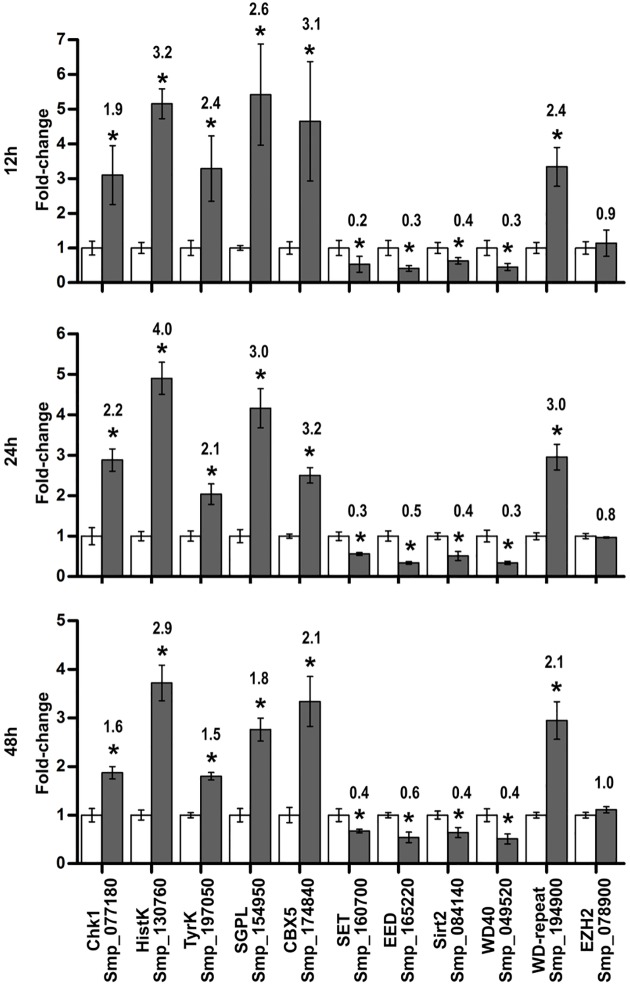
Fig 6. Validation by RT-qPCR of differentially expressed genes detected by microarray.
Eleven selected genes with expression induced, repressed or not affected by treatment of schistosomula with 1 μM TSA for 12, 24 and 48 h were analyzed by relative quantitative PCR method normalized by the housekeeping PSMD gene (Smp_000740). We compared TSA treated samples (solid bars) with controls (open bars), and the graphs show the mean ± S.D. of three biological replicates for each condition. Statistical significance was evaluated with the t-test and significant changes are marked with asterisk (p-value ≤ 0.05). For comparison, we report above each solid bar the mean fold-change measured by microarray.

