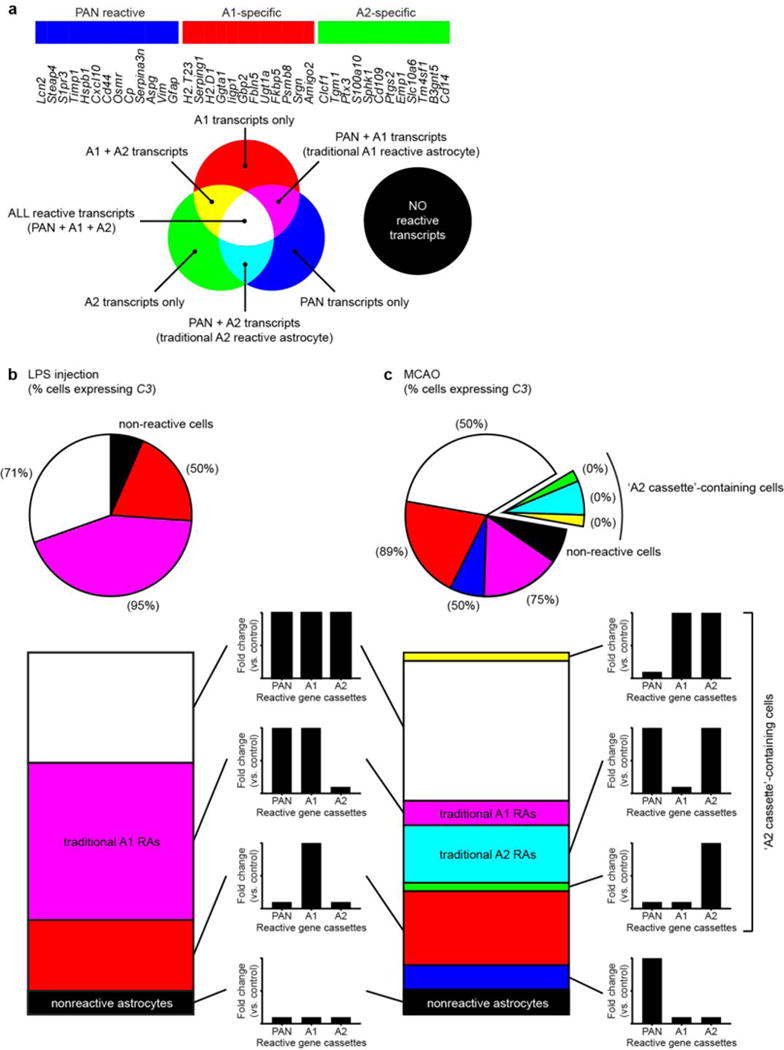
EXTENDED DATA FIG 12. Single cell analysis of C3 expression following neuroinflammatory and ischemic injury.

a, cassettes of PAN-, A1-, and A2-specific gene transcripts used to determine polarization state of astrocyte reactivity. Upregulation of combinations of each of these cassettes of genes produces different 8 possible gene profiles for astrocytes following injury. b, 24 hours following LPS-induced systemic neuroinflammation, astrocytes were either non-reactive (no reactive genes upregulated), or fell into three forms of reactivity – all with A1 reactive cassette genes upregulated. Numbers in parenthesis state what percentage of individual cells for each subtype express C3. c, 24 hours following middle cerebral artery occlusion, both neuroinflammatory (A1 and A1-like) and ischemic (A2 and A2-like) reactive cells were detected. No cells expressing A2 cassette transcripts were C3 positive – validating C3 as an appropriate marker for visualizing A1 reactive astrocytes in disease. Segments of piecharts represent relative amounts of each subtype of astrocyte (control or reactive).
